Question 12 Marks
Read the following bar graph and answer the following questions:
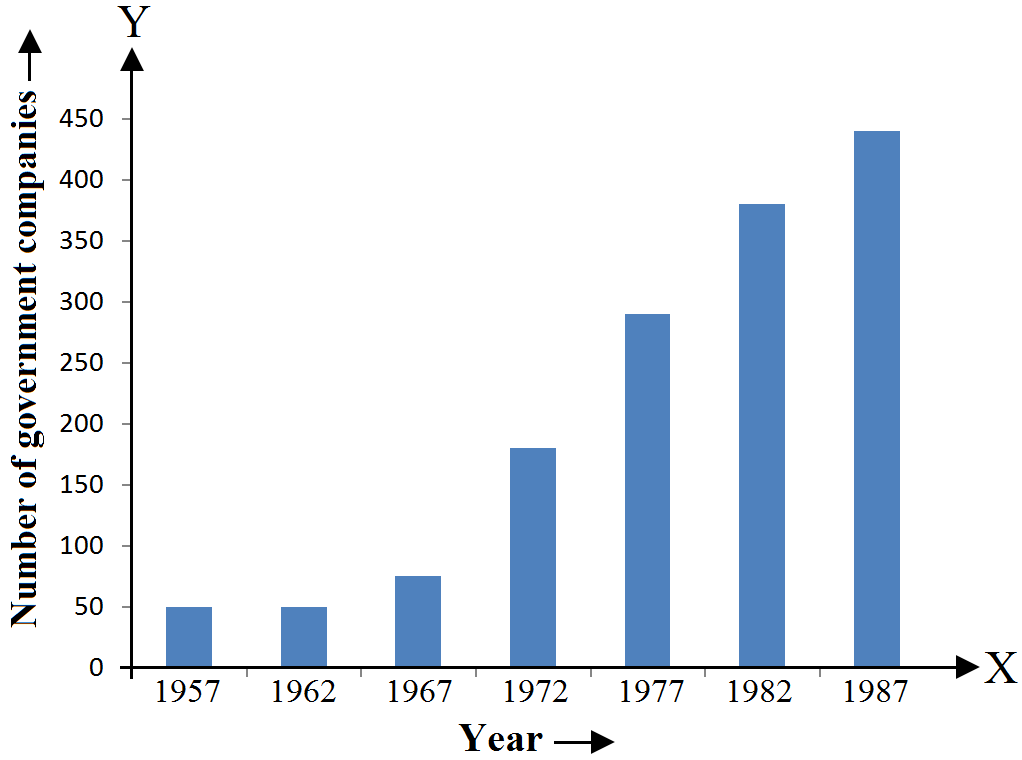
- What is the information given by the bar graph?
- State the following whether true or false.
Answer
As no data is given for the year 1983, we cannot tell anything about this. Hence, the given statement is false.
View full question & answer→- The bar graph represents the number of government companies in India from 1957 to 1987.
- False.
As no data is given for the year 1983, we cannot tell anything about this. Hence, the given statement is false.