Questions

5 Mark Question

Take a timed test

7 questions · self-marked practice — reveal the answer and mark yourself.

Question 15 Marks
The sale of electric bulbs on different days of a week is shown below:

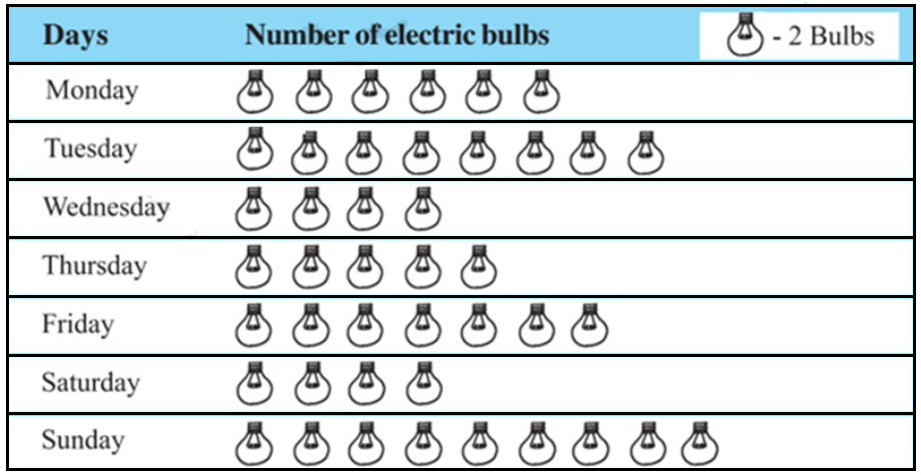
Observe the pictograph and answer the following questions:
  1. How many bulbs were on Friday?
  2. On which day maximum number of bulbs were sold?
  3. If one bulb was sold at the rate of Rs 10, what was the total earning on sunday?
  4. Can you find out the total earning of the week?
  5. If one big carton can hold 9 bulbs. How many cartons were needed in the given week, more than 7, more than 8 or more than 9?
Answer
  1. Number of figures of bulbs shown against Friday = 7
Given, 1 figure = 2 bulbs

Therefore, Total number of bulbs sold on Friday = 2 × 7 = 14
  1. Sunday shows the maximum number of figure of bulbs, i.e. 9
Therefore, On Sunday, maximum bulbs were sold.
  1. Number of figures of bulbs shown against Sunday = 9
Therefore, Total number of bulbs sold on Sunday = 2 × 9 = 18

Given, the cost of each bulb = ₹ 10

Therefore, Total earning on Sunday = ₹ 10 × 18 = ₹ 180
  1. Total number of figures of bulbs shown throughout the week
= 6 + 8 + 4 + 5 + 7 + 4 + 9 = 43

Therefore, Total number of bulbs = 43 × 2 = 86

Therefore, Total earning of the week = ₹ 10 × 86 = ₹ 860.
  1. Total number of bulbs = 86
Given that one big carton can hold 9 bulbs.

Therefore, for holding 86 bulbs, we need

869 = 959 cartons

So, more than 9 cartons are needed.
View full question & answer
Question 25 Marks
Total number of students of a school in different years is shown in the following table:
Year
Number of students
1996
400
1998
550
2000
450
2002
600
2006
650
Represent the above data by a pictograph.
Prepare another pictograph of students using any other symbol each represents students. Which pictograph do you find more informative?
Answer
Let one icon represent 50 students. Then, the numbers of icons for different years are as follows:
Year Number of students
1996 $\frac{400}{50}=8$
1998 $\frac{550}{50}=11$
2000 $\frac{450}{50}=9$
2002 $\frac{600}{50}=12$
2006 $\frac{650}{50}=13$

The second pictograph is more informative. Explanation: in the second pictograph, every icon is complete, therefore more convenient to understand.
View full question & answer
Question 35 Marks
Total number of students of a school in different years is shown in the following table:
Year
Number of students
1996
400
1998
550
2000
450
2002
600
2006
650
Represent the above data by a pictograph.
Prepare a pictograph of students using one symbol an icon of a student to represent students and answer the following questions:
  1. How many symbols represent total number of students in the year 2002?
  2. How many symbols represent total number of students for the year 1998?
Answer
Let one icon represent 100 students. Then, the numbers of icons for different years are as follows:
Year Number of students
1996 $\frac{400}{100}=4$
1998 $\frac{550}{100}=5.5$
2000 $\frac{450}{100}=4.5$
2002 $\frac{600}{100}=6$
2006 $\frac{650}{100}=6.5$
The pictograph representing the above data is as follows:
  1. 6 icons represent the total number of students in the year 2002.
  2. 5 and half icons represent the total number of students in the year 1998.
View full question & answer
Question 45 Marks
The number of girl students in each class of co-ed. Middle school is depicted by the following pictograph:

Observe the above pictograph and answer the following questions:
  1. Which class has the maximum number of girl students?
  2. Is the number of girls in class VI is less than the number of girls in class V?
  3. How many girls are there in VII class?
Answer
Based on the above pictograph, we can prepare the following chart to determine the number of girl students in each class.
Given, 1 figure = 4 girls
Class
Numbers of girls
I
6 x 4 = 24
II
4.5 x 4 = 18
III
5 x 4 = 20
IV
3.5 x 4 = 14
V
2.5 x 4 = 10
VI
4 x 4 = 16
VII
3 x 4 = 12
VIII
1.5 x 4 = 6
  1. From the chart we can easily say that the maximum number of girls i.e 24 are present in Class I
Therefore, Class I has the maximum number of girls.
  1. Number of girls in class VI = 16
Number of girls in class V = 10

Therefore, number of girls in class VI is not less than the number of girls in class V No.
  1. From the chart, we can say that these are 12 girls in class VII.
View full question & answer
Question 55 Marks
The pictograph shown different subject books which are kept in a library.
  1. How many English books are there in the library?
  2. How many maths books are there?
  3. Which books are maxmimum in number?
  4. Which books are minimum in number?
Answer
Based on the above pictograph and the given data, we can prepare the following chart to ascertain the number of books present in the library for each subject:
Subjects
Numbers of books
Hindi
5.5 × 100 = 550
English
8 × 100 = 800
History
2 × 100 = 200
Science
4 × 100 = 400
Math
2.5 × 100 = 250
  1. From the above charts, we can say that there are 800 English books in the library.
  2. The calculation on the above chart shows that there are 250 Math books in the library.
  3. From the above charts, we can say that the English books are maximum in number, as there are 800 books on that subject. Therefore, English.
  4. From the above chart, we can see that the History books are minimum in number, as there are only 200 books of that subjects. Therefore, History.
View full question & answer
Question 65 Marks
In a village six fruit merchants sold the following number of fruit baskets in particular season:

Observe the above pictograph and answer the following questions.
  1. Which merchant sold the maximum number of baskets?
  2. How many fruit baskets ware sold by answer?
  3. The merchants who have sold 600 or more number of baskets are planning to buy a godown for the next season. Can you name them?
Answer
Given, one figure = 100 fruit baskets
Based on the above pictographs and hints, we can prepare the following charts to ascertain the maximum number of fruit baskets sold by each merchant:
Merchant
Numbers of fruit baskets
Rahim
4 × 100 = 400
Lakhan pal
5.5 × 100 = 550
Anwar
7 × 100 = 700
Martin
9.5 × 100 = 950
Ranjit singh
8 × 100 = 800
Joseph
4.5 × 100 = 450
  1. Martin.
  2. Anwar sold 700 fruit baskets.
  3. On the above chart we can see that Anwar sold 700 fruit baskets, Martin sold 950 fruit baskets and Ranjit Singh sold 800 fruit baskets. Therefore, Anwar, Martin and Ranjit Singh are the merchants who are planning to buy a godown for the next season.
View full question & answer
Question 75 Marks
The following are the details or the number of students in a class of 30 students in a class of 30 students present during a week.
Day
Number of students present
Monday
24
Tuesday
20
Wednesday
28
Thursday
30
Friday
26
Saturday
22
Represent the above data by a pictograph.
Answer
Let an icon of a student represent 4 students. Then, the number of icons for each day is as follows:
Day Number of students present
Monday $\frac{24}{4}=6$
Tuesday $\frac{20}{4}=5$
Wednesday $\frac{28}{4}=7$
Thursday $\frac{30}{4}=7.5$
Friday $\frac{26}{4}=6.5$
Saturday $\frac{22}{4}=5.5$
The pictograph representing the above data is as follows:
View full question & answer