Question 15 Marks
Consider the following data gathered from a survey of a colony:
Draw a double bar graph choosing an appropriate scale. What do you infer from the bar graph?
|
Favorite Sport
|
Cricket
|
Basket ball
|
Swimming
|
Hockey
|
Athletics
|
|
Watching
|
1240
|
470
|
510
|
423
|
250
|
|
Participating
|
620
|
320
|
320
|
250
|
105
|
- Which sport is most popular?
- What is more preferred watching or participating in sports?
Answer
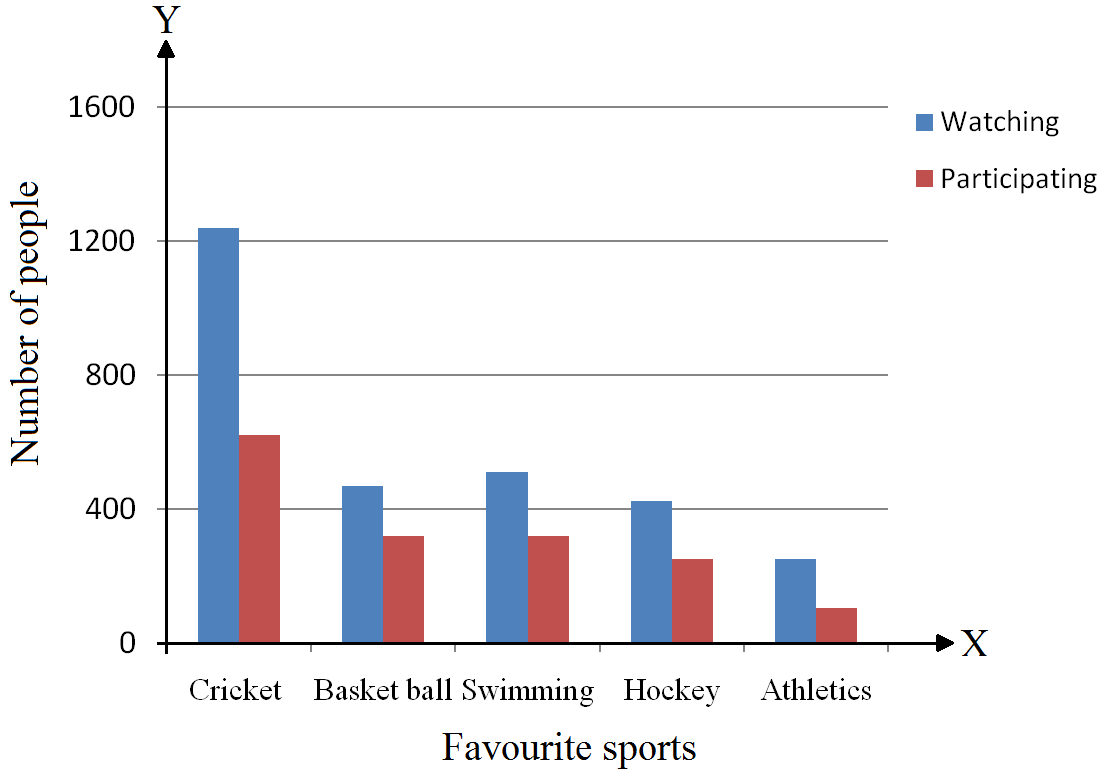 Mark the horizontal axis OX as “Favourite Sports” and the vertical axis OY as “Number of People”.
Along the horizontal axis OX, choose bars of uniform (equal) width, with a uniform gap between them.
Choose a suitable scale to determine the heights of the bars, according to the space available for the graph. Here, we choose 2 big divisions to represent 400 people.
View full question & answer→Mark the horizontal axis OX as “Favourite Sports” and the vertical axis OY as “Number of People”.Along the horizontal axis OX, choose bars of uniform (equal) width, with a uniform gap between them.
Choose a suitable scale to determine the heights of the bars, according to the space available for the graph. Here, we choose 2 big divisions to represent 400 people.
- Cricket is the most popular sport.
- Watching is preferred over participation.
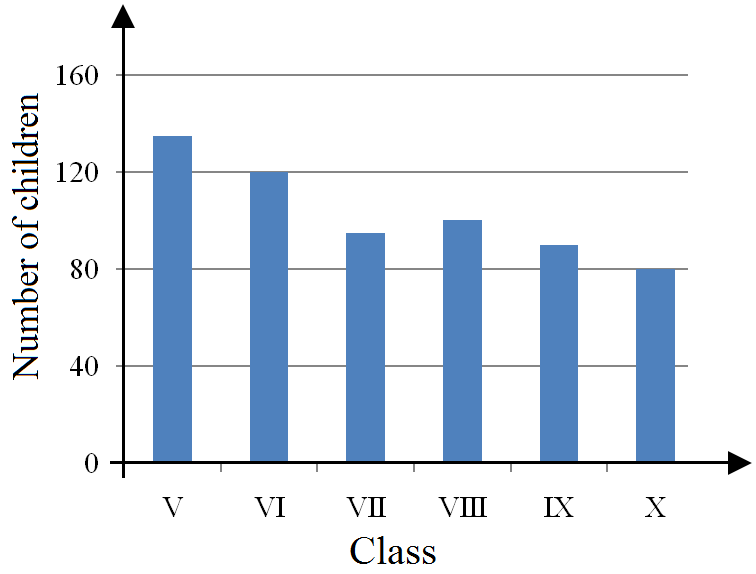 Mark the horizontal axis OX as “Class” and the vertical axis OY as “Number of Children”.
 We choose 1 small division to represent 1 child in the graph.
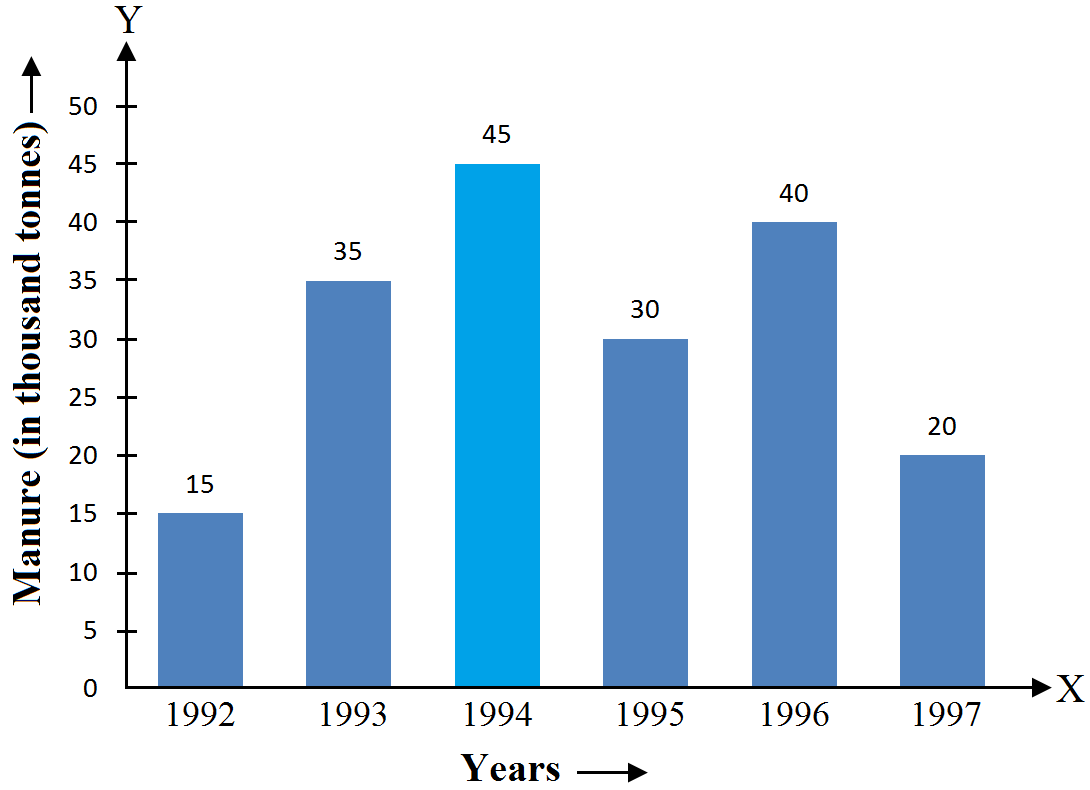 Mark the horizontal axis OX as “Years” and the vertical axis OY as “Production of food grains (in thousand tonnes)”.
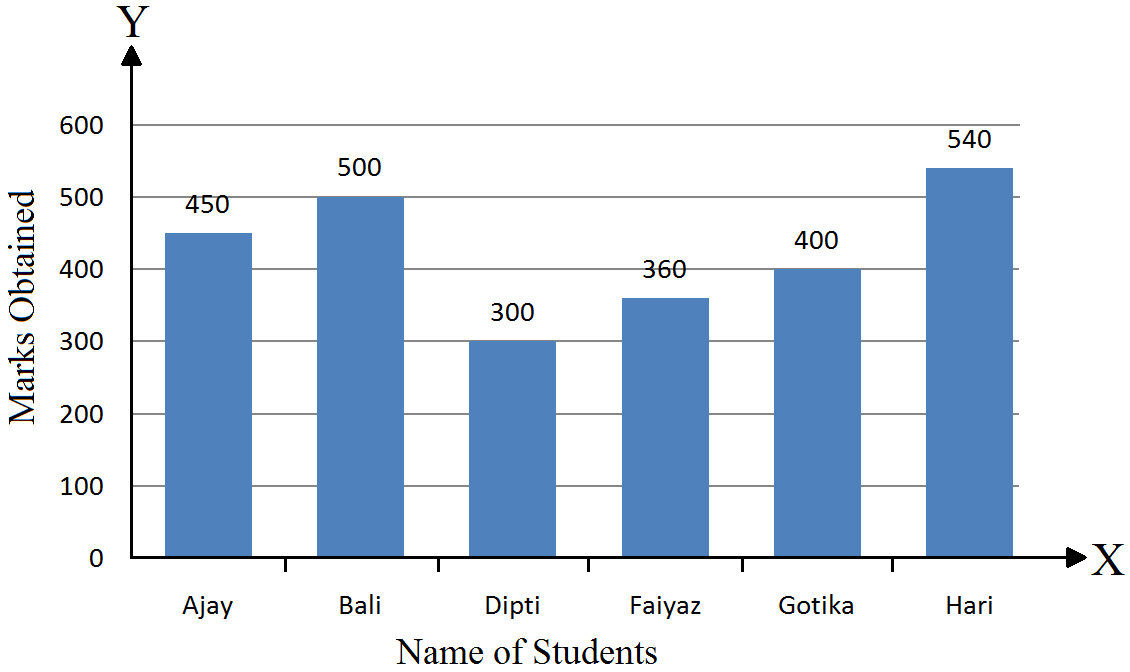
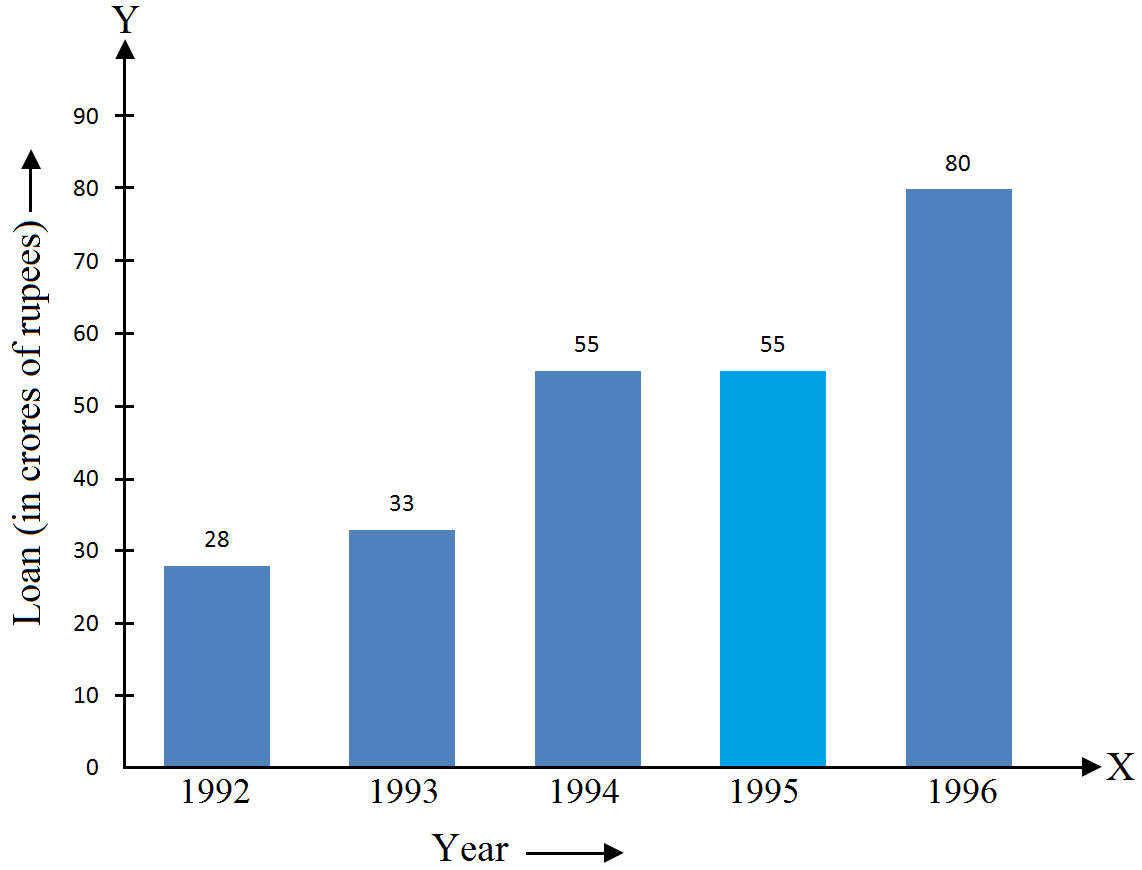 Mark the horizontal axis OX as “Years” and the vertical axis OY as “Loan (in crores of rupees)”.
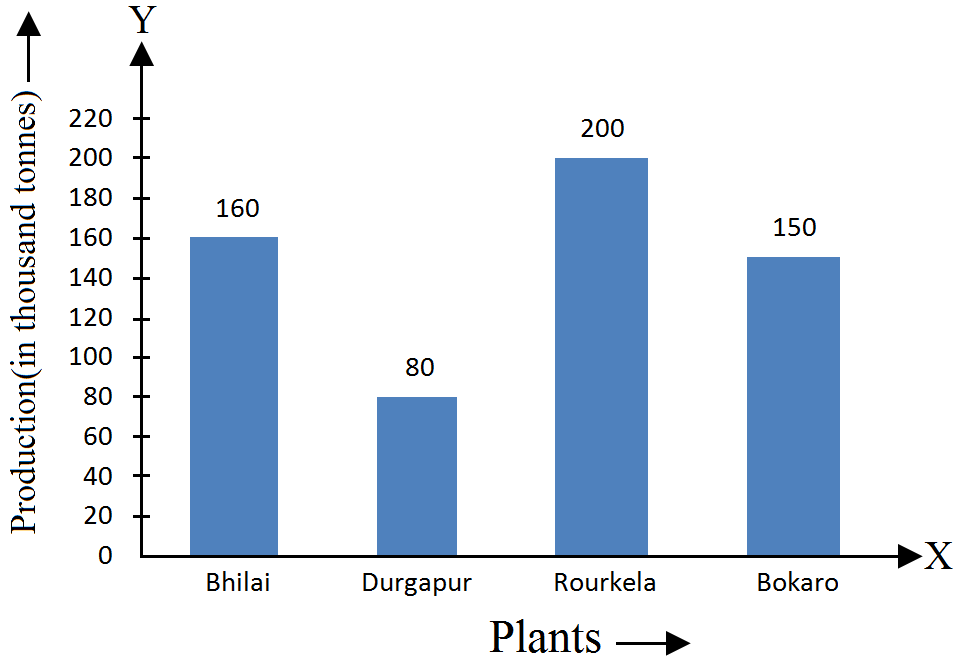 Mark the horizontal axis OX as “Name of the Steel Plant” and the vertical axis OY as Production (in thousand tonnes)”.
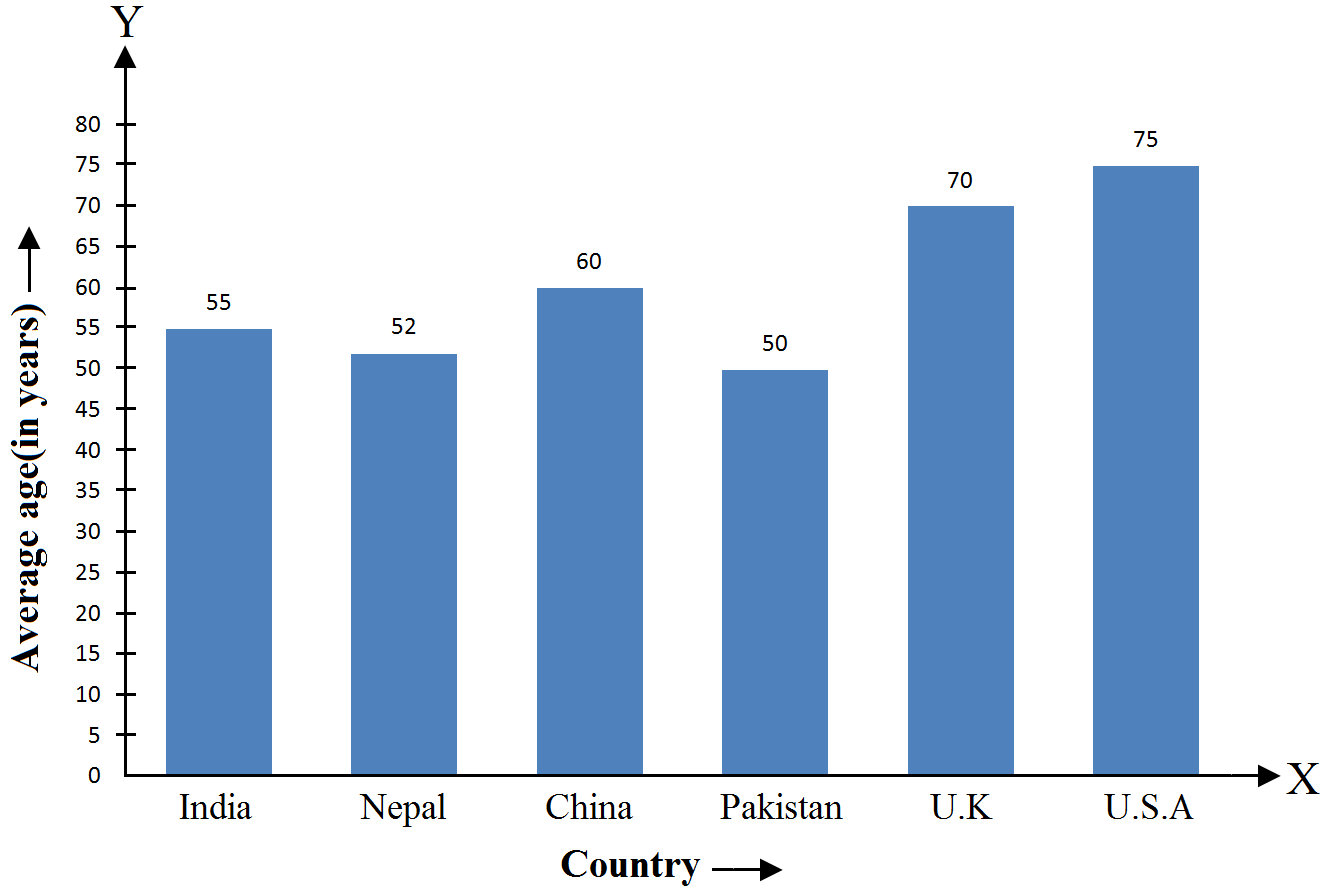 Mark the horizontal axis OX as “Countries” and the vertical axis OY as “Average Age of men (in years)”.
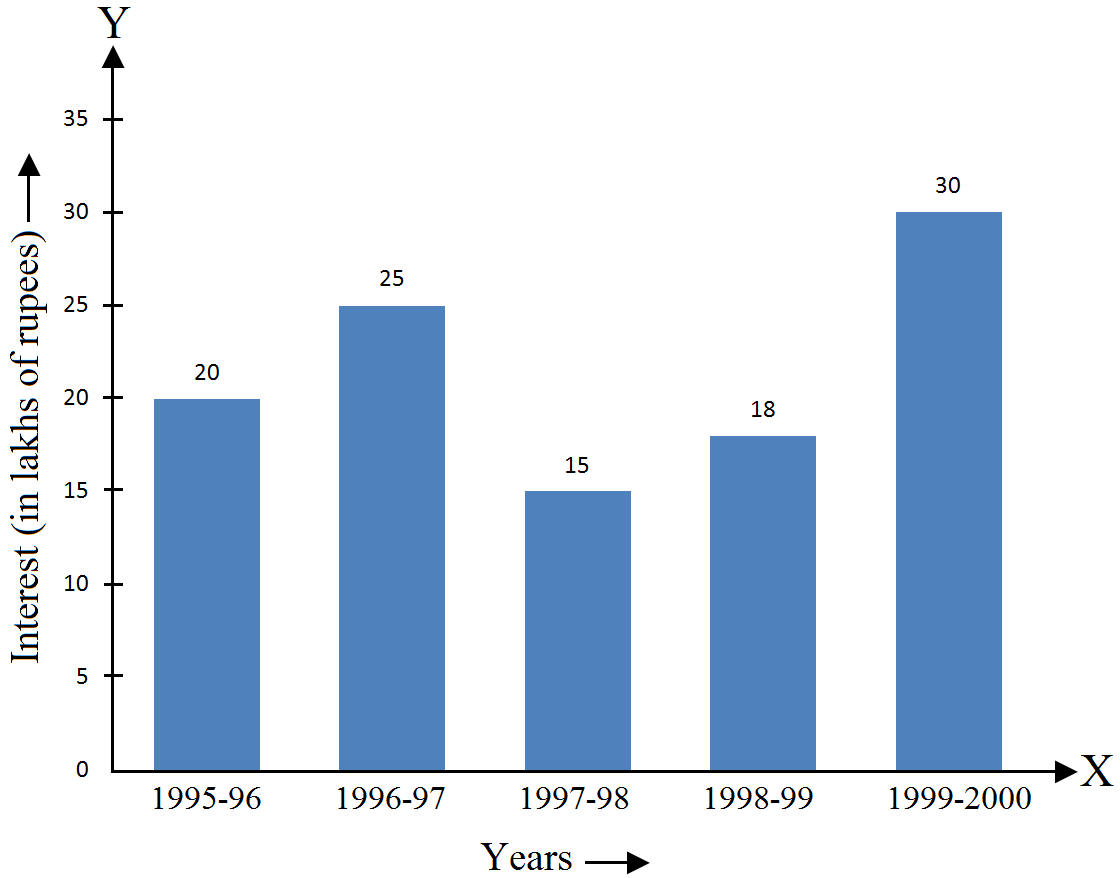 Mark the horizontal axis OX as “Years” and the vertical axis OY as “Interest (in lakhs of rupees)”.
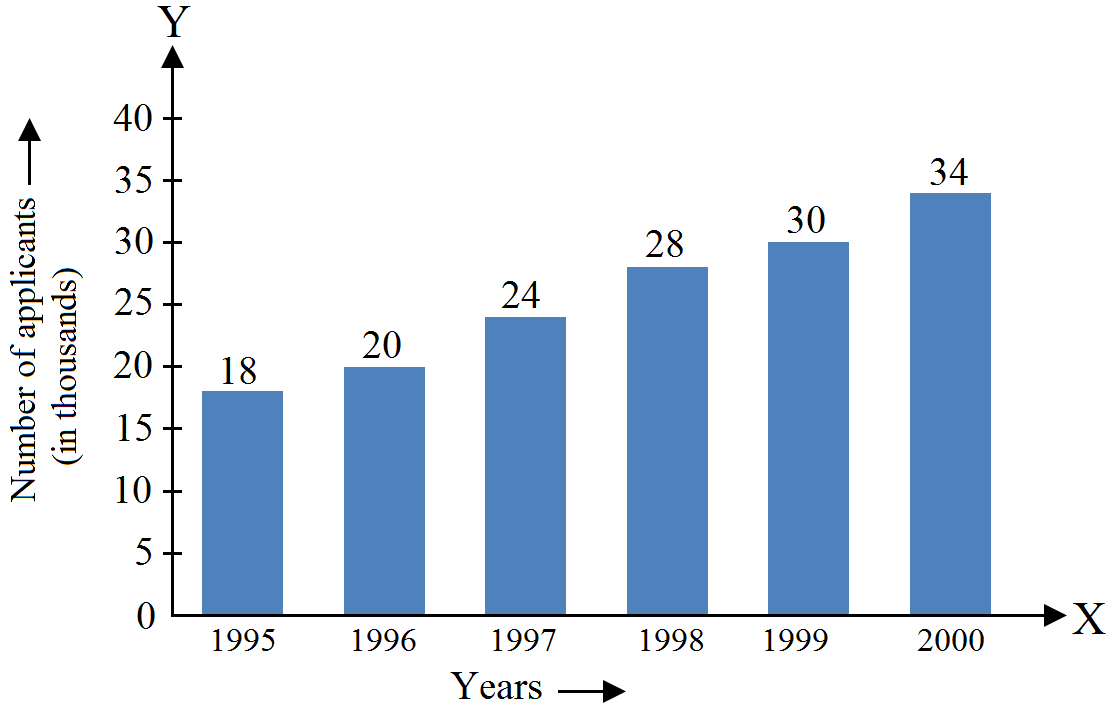 Mark the horizontal axis OX as “Years” and the vertical axis OY as “Number of Applicants Registered (in thousands)”.
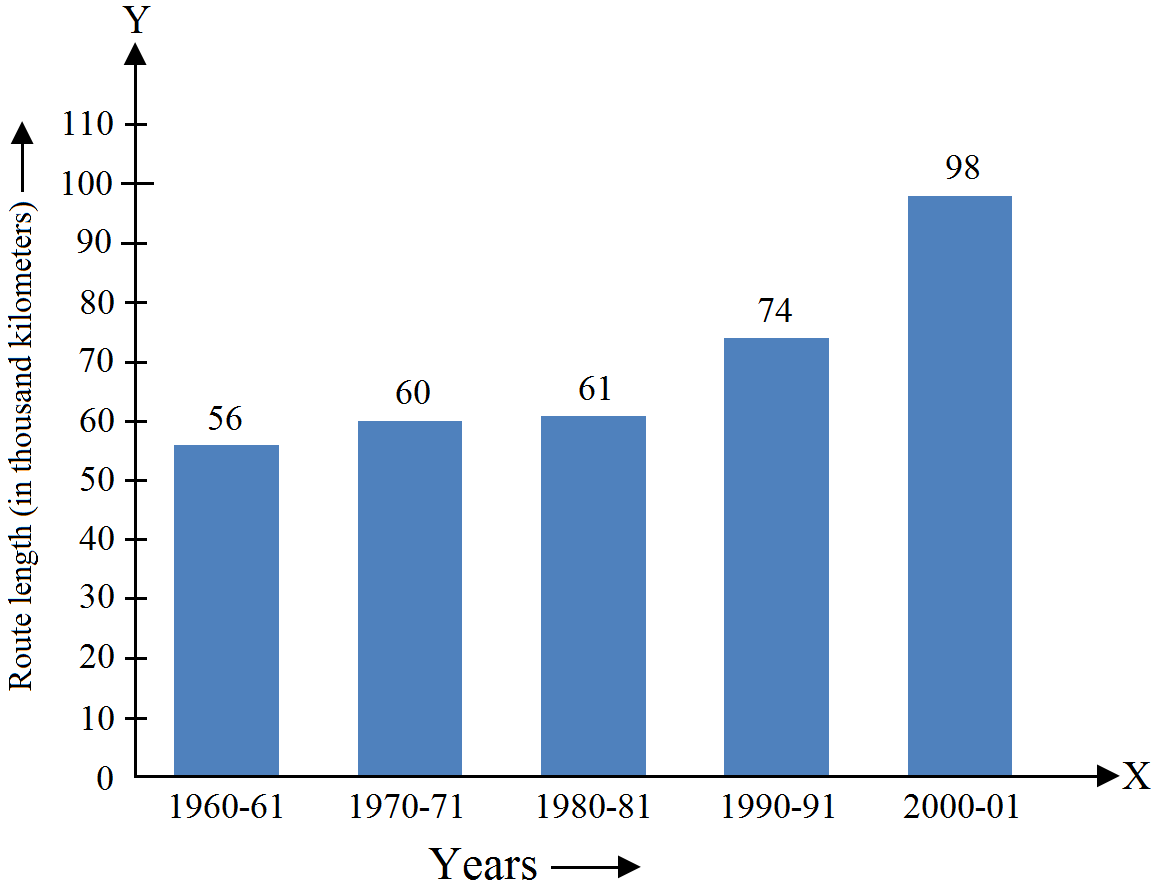 Mark the horizontal axis OX as “Years” and the vertical axis OY as “Route Length (in thousand kilometres)”.
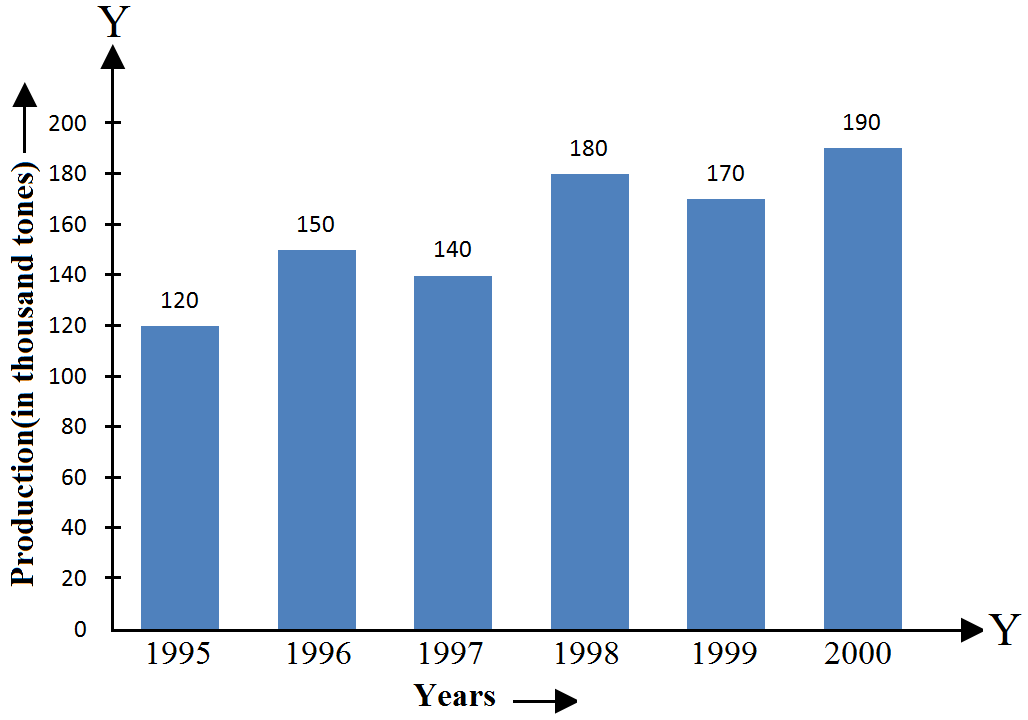 Mark the horizontal axis OX as “Years” and the vertical axis OY as “Production of food grains (in thousand tonnes)”.
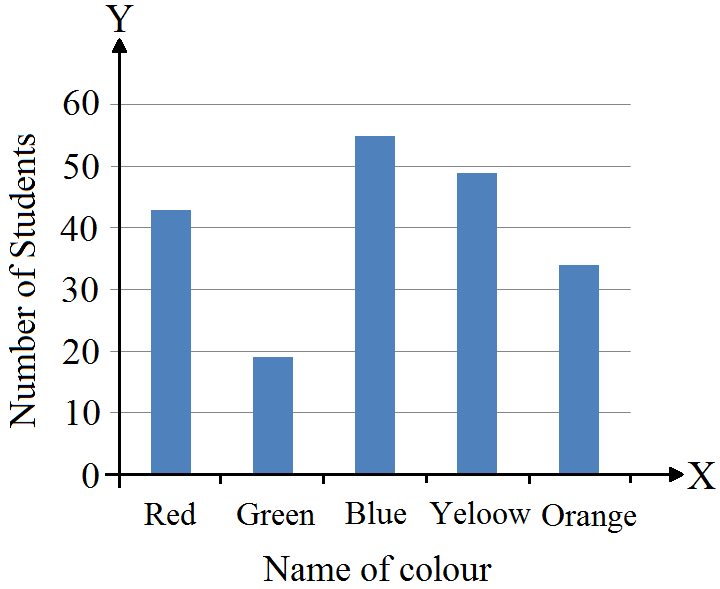 Mark the horizontal axis OX as “Name of the Colour” and the vertical axis OY as “Number Of Students”.