Collect various kinds of graphs from newspapers and discuss them.
i. Histogram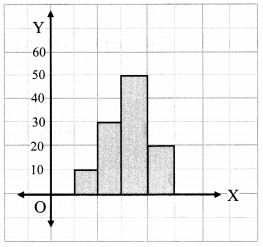
ii. Line graph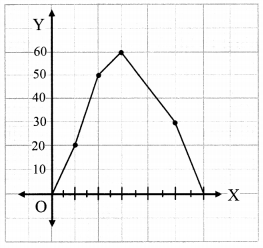
iii. Pie chart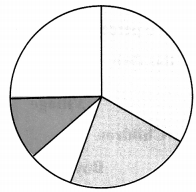
7 questions across 2 question groups — pick any mix to generate a Maths paper with step-by-step answer keys.
One sample from each question group in this chapter. Select any group above to see the full set with answer keys.
i. Histogram
ii. Line graph
iii. Pie chart
| 1971 | 1981 | 1991 | 2001 | 2011 | |
| Maharashtra | 46 | 57 | 65 | 77 | 83 |
| Gujarat | 40 | 45 | 61 | 69 | 79 |
| D.P.T. (Booster) | Polio (Booster) | Measles | Hepatitis | |
| Solapur | 65 | 60 | 65 | 63 |
| Pune | 89 | 87 | 88 | 86 |
| Mumbai | Kolkata | Nagpur | Kapurthala | |||
| 37 | 47wQbNPTDJp9hMYdvogK2hAUiHsGeiybwaWe36bwtRQ3UTpYV7YuZ8FV5j9nauFCWwcjM6dTzpL5s2N79Rp5unwdMvc8ZKU> | 26 | 25 | 26 | 29 | 26 |
| Persons\Booth No. | 1 | 2 | 3 | 4 | 270 | 560 | 820 | 850 |
| Women | 700 | 240 | 340 | 640 | 470 |
| Days\Fruits | Sweet Lime | Orange | Apple | Pineapple |
| Saturday | 47wQbNPTDJp9hMYdvogK2hAUiHsGeiybwaWe36bwtRQ3UTpYV7YuZ8FV5j9nauFCWwcjM6dTzpL5s2N79Rp5unwdMvc8ZKU="125">56 | 40 | ||
| Sunday | 59 | 65 | 78 | 67 |
Pick question groups from the list above, set marks and difficulty, and export a branded PDF with step-by-step answer keys. First 3 chapters free — no signup.