Questions

5 Mark Question

Take a timed test

12 questions · self-marked practice — reveal the answer and mark yourself.

Question 15 Marks
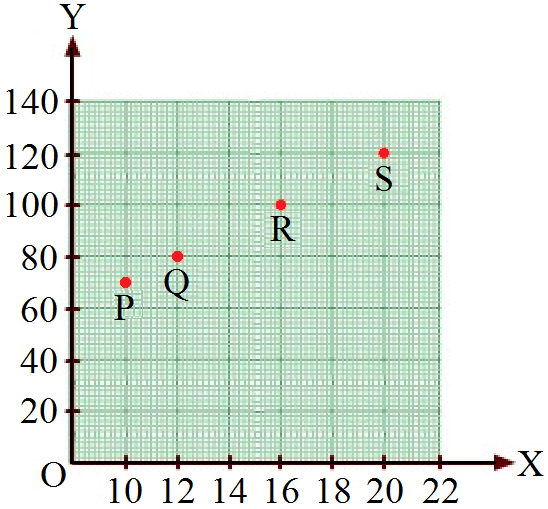
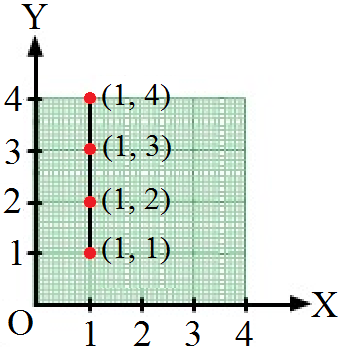
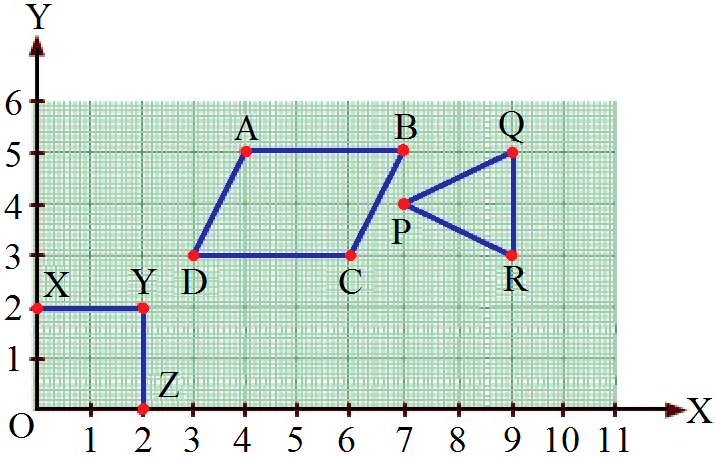
Find the coordinates of points P, Q, R and S in Figure.
Answer

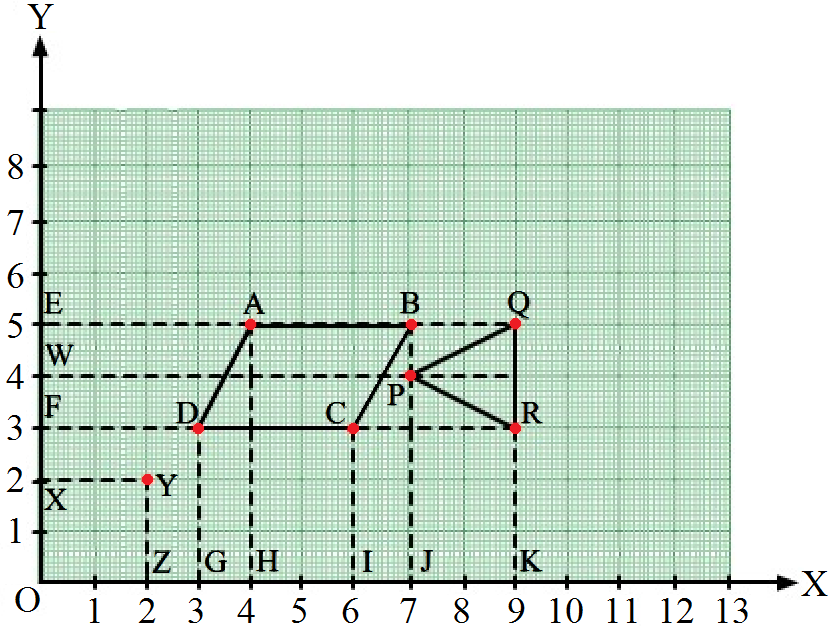
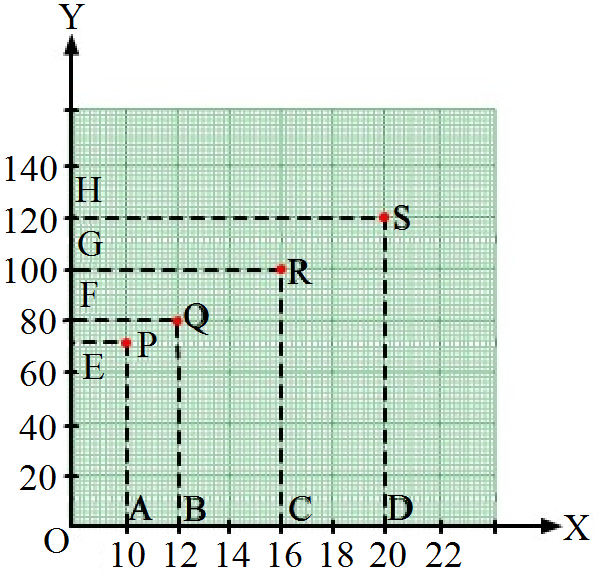
Draw perpendiculars PA, QB, RC and SD from vertices P, Q, R and S on the x-axis.
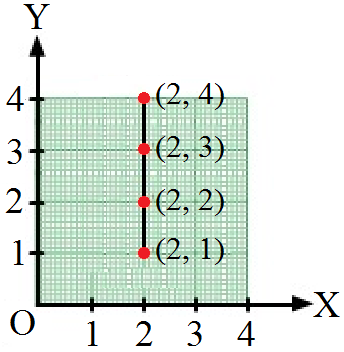
Also ,draw perpendiculars.
PE, QF, RG and SH on the y-axis from these points.
PE = 10 units and PA = 70 units.
Therefore, the coordinates of vertex P are (10, 70).
QF = 12 units and QB = 80 units
Therefore, the coordinates of vertex Q are (12, 80).
RG = 16 units and RC = 100 units
Therefore, the coordinates of vertex R are (16, 100).
SH = 20 units and SD = 120 units
Therefore, the coordinates of vertex S are (20, 120).
View full question & answer
Question 25 Marks
The runs scored by a cricket team in first 15 overs are given below:
Overs: I II III IV V VI VII VIII IX X XI XII XIII XIV XV
Runs: 2 1 4 2 6 8 10 21 5 8 3 2 6 8 12
Draw the graph representing the above data in two different ways as a graph and as a bar chart.
Answer

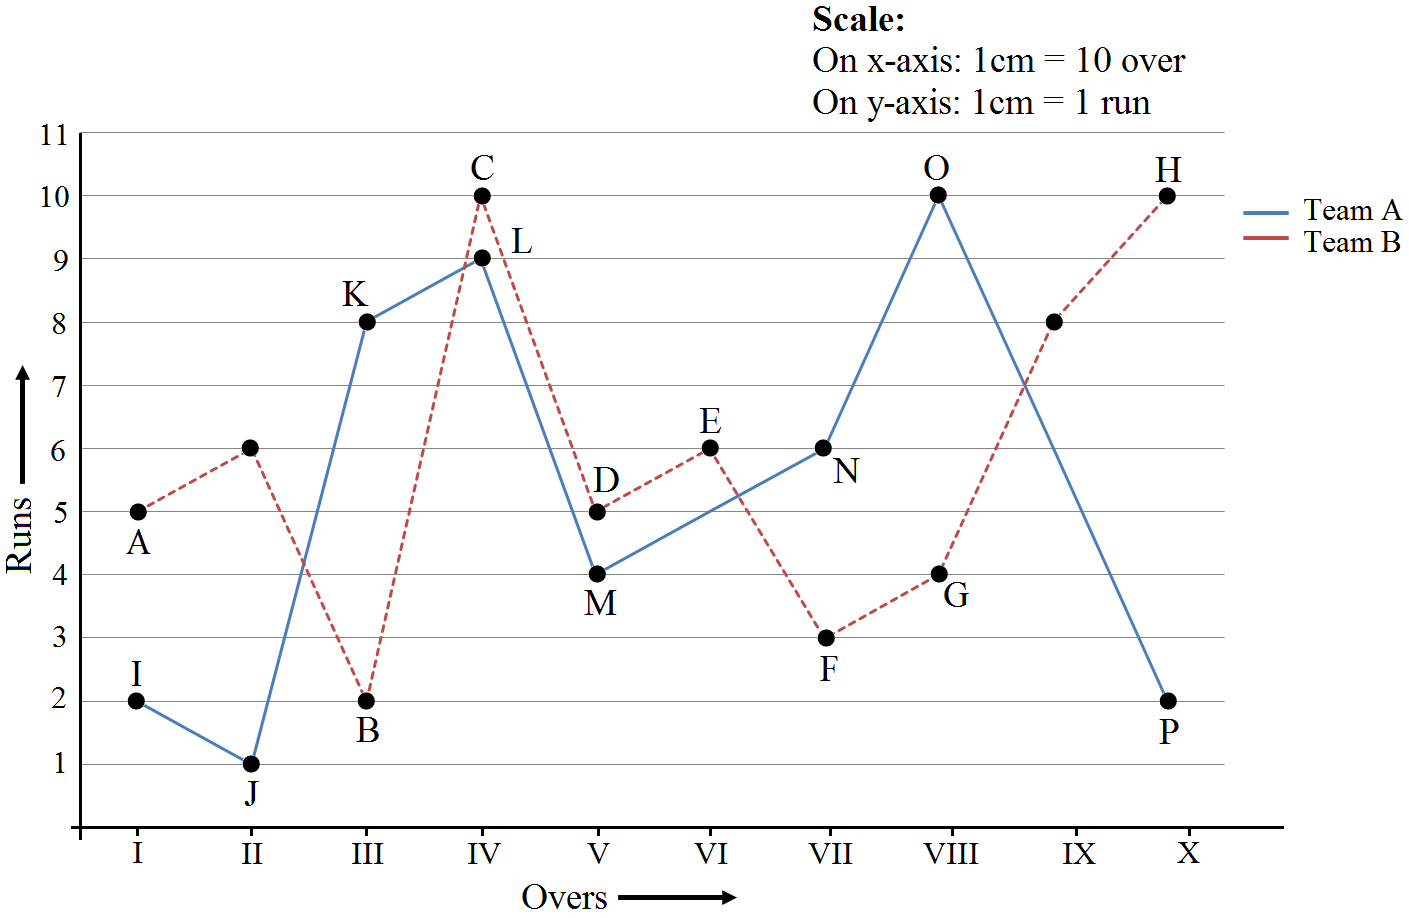
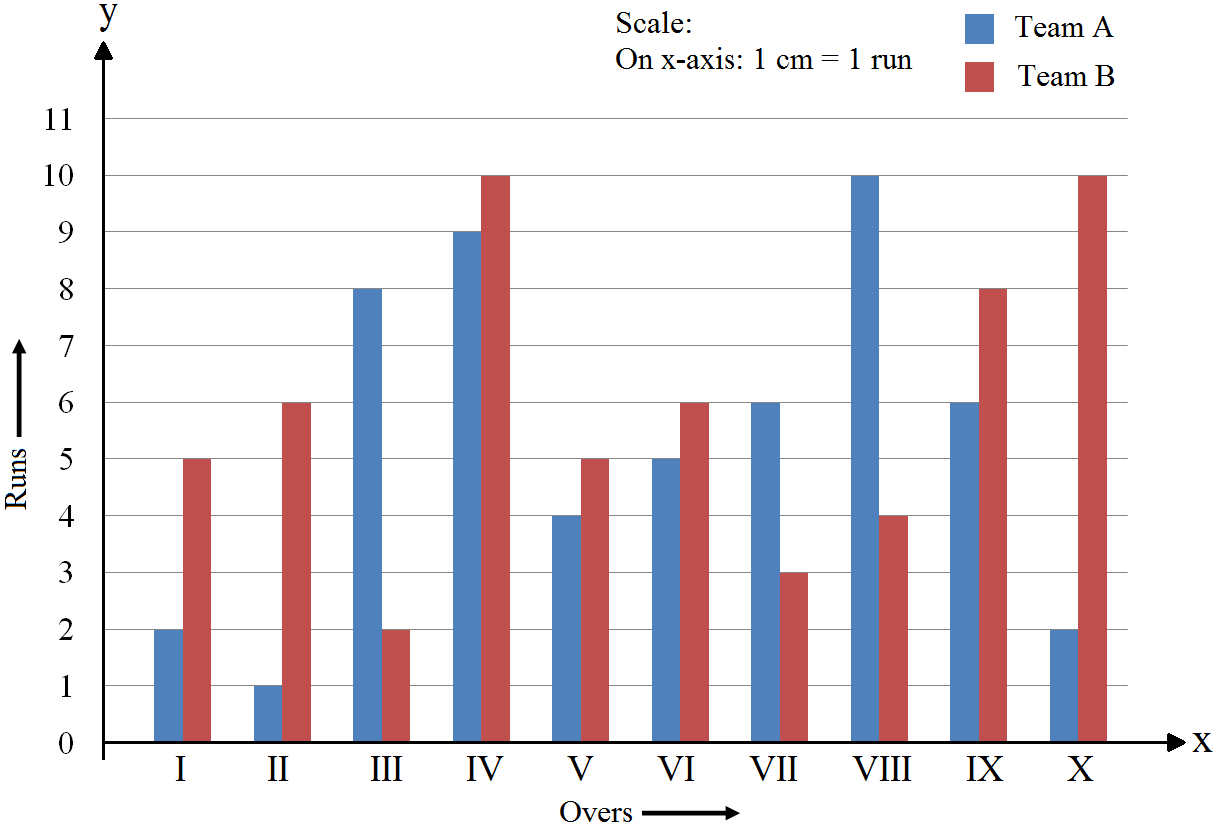
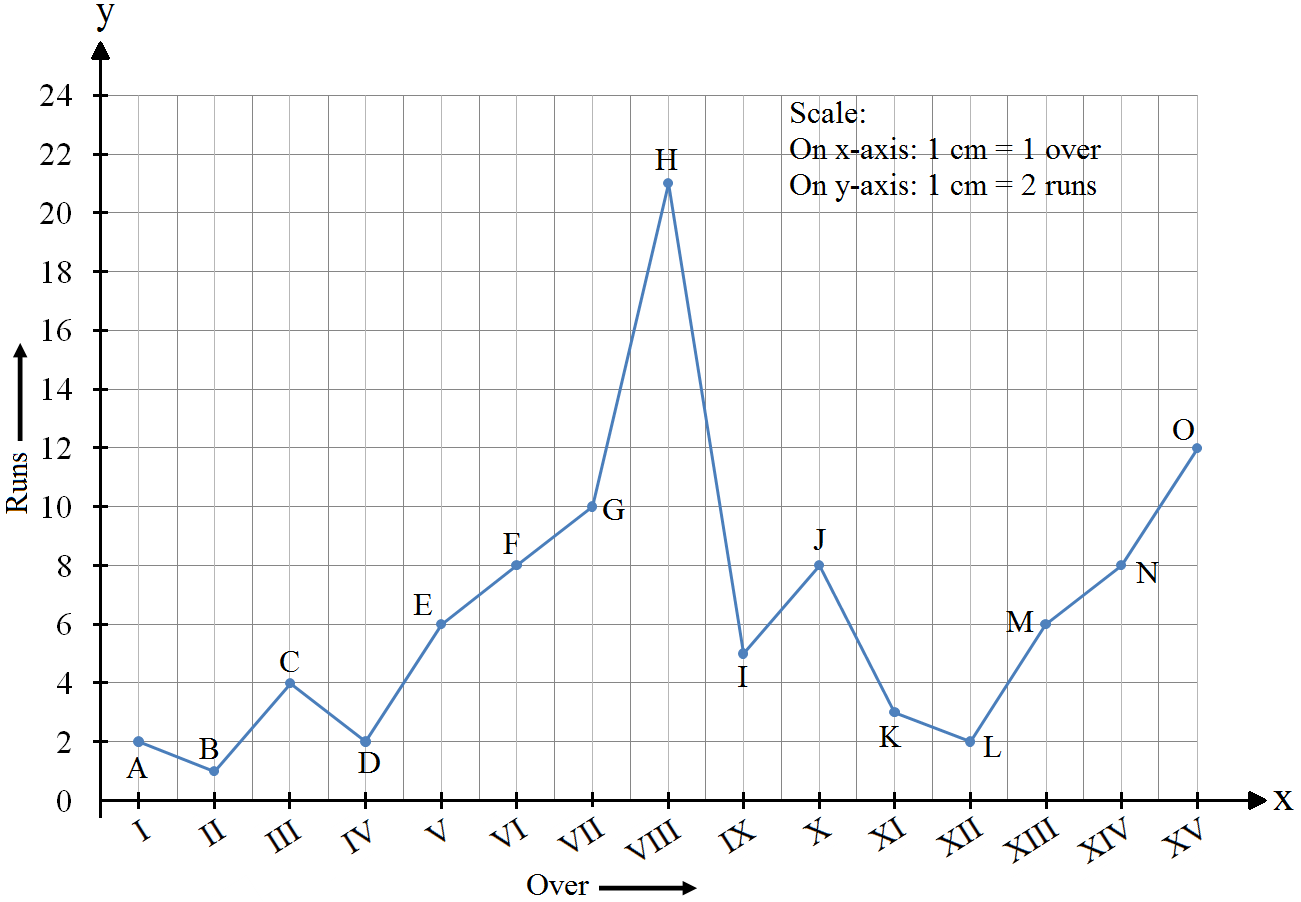
Here, over is an independent variable and run is a dependent variable. So, we take overs on the x-axis and runs the on y-axis.
Let us choose the following scale:
  • On x-axis: 1cm = 1 over
  • On y-axis: 1cm = 2 runs
Now, let us plot (I, 2), (II, 1), (III, 4), _____, (XV, 12). These points are joined to get the graph representing the given information as shown in the figure below.
View full question & answer
Question 35 Marks
The following table shows the number of patients discharged from a hospital with HIV diagnosis in different years:
Years: 2002 2003 2004 2005 2006
Number of patients: 150 170 195 225 230
Answer

Here, years is an independent variable and the number of patients is a dependent variable. So, we take years on the x-axis and the number of patients on the y-axis.
Let us choose the following scale:
  • On x-axis: 2cm = 1 year
  • On y-axis: 1cm = 10 patients
Also, let us assume that on the x-axis, origin (O) represents 2001 and on the y-axis, origin (O) represents 120, i.e. O (2001, 120).
Now, let us plot (2002, 150), (2003, 170), (2004, 195), (2005, 225), (2006, 230). These points are joined to get the graph representing the given information as shown in the figure below.
View full question & answer
Question 45 Marks
The runs scored by two teams A and B in first 10 overs are given below:
Overs: I II III IV V VI VII VIII IX X
Team A: 2 1 8 9 4 5 6 10 6 2
Team B: 5 6 2 10 5 6 3 4 8 10
Draw a graph depicting the data, making the graphs on the same axes in each case in two different ways as a graph and as a bar chart.
Answer


Here, over is an independent variable and run is a dependent variable. So, we take overs on x-axis and runs on y-axis.
Let us choose the following scale:
  • On x-axis: 1cm = 1 over.
  • On y-axis: 1cm = 1 run.
Now, let us plot (I, 2), (II, 1), (III, 8),
___ ,(X, 2) for team A and (I, 5), (II, 6), (III, 8), ___ (X, 10) for team B. These points are joined to get the graph representing the given information as shown in the figure below.​
View full question & answer
Question 55 Marks
Locate the points:
  1. (1, 1), (1, 2), (1, 3), (1, 4)
  2. (2, 1), (2, 2), (2, 3), (2, 4)
  3. (1, 3), (2, 3), (3, 3), (4, 3)
  4. (1, 4), (2, 4), (3, 4), (4, 4).
Answer
  1. In order to plot these points, the given steps are to be followed:
Take a point O on a graph paper and draw horizontal and vertical lines OX and OY respectively.

Then, let on x-axis and y axis 1cm represents 1 unit.

In order to plot point (1, 1), we start from the origin O and move 2cm along OX and 1cm along OY. The point we arrive at is (1, 1).

To plot point (1, 2), we move 1cm along OX and 2cm along OY. The point we arrive at is (1, 2).

To plot point (1, 3), we move 1cm along OX and 3cm along OY. The point we arrive at is (1, 3).

To plot point (1, 4), we move 1cm along OX and 4cm along OY. The point we arrive at is (1, 4).

  1. Follow the steps mentioned in point (i).
​​​​​​
  1. Follow the steps mentioned in point (i).
  1. Follow the steps mentioned in point (i).
View full question & answer
Question 65 Marks
The following table shows the sales of a commodity during the years 2000 to 2006.
Years: 2000 2001 2002 2003 2004 2005 2006
Sales (in lakhs of Rs): 1.5 1.8 2.4 3.2 5.4 7.8 8.6
Draw a graph of this information.
Answer
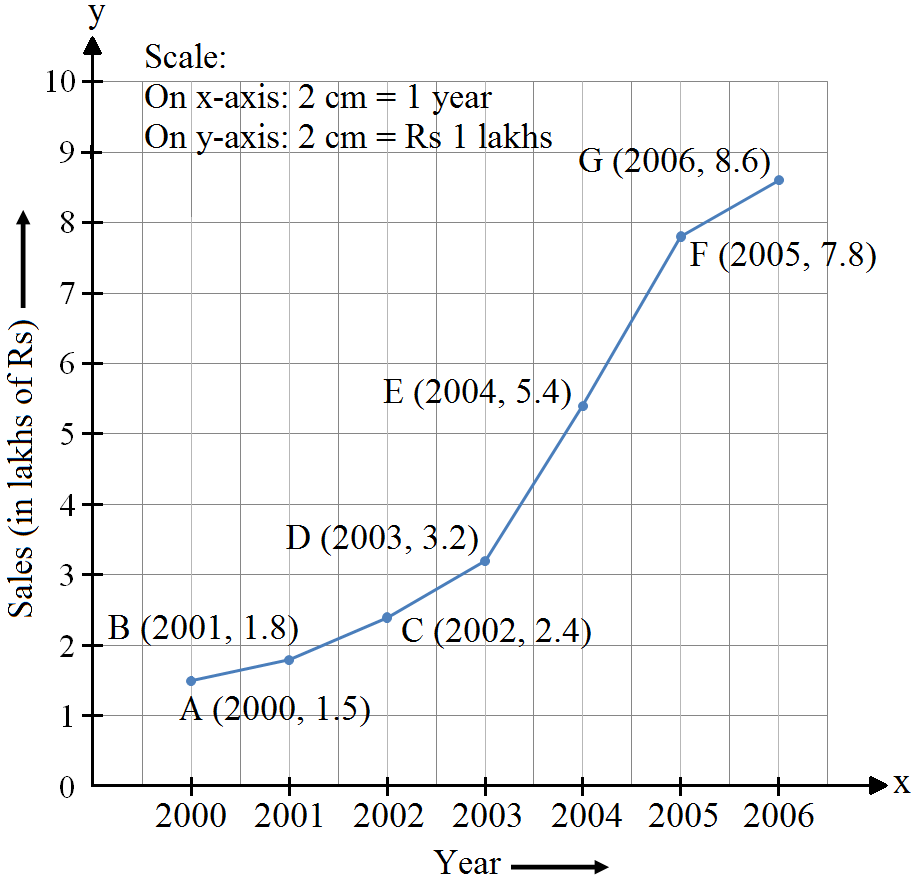
Here, year is an independent variable and sales is a dependent variable. So, we take year on the x-axis and sales on the y-axis.Let us choose the following scale:
  • On x-axis: 2cm = 1 year
  • On y-axis: 2cm = 1 lakh rupees
Assume that on x-axis, origin (O) represents 1991. So, the coordinates of O are (1991, 0). Now, let us plot (2000, 1.5), (2001, 1.8), (2002, 2.4), (2003, 3.2), (2004, 5.4), (2005, 7.8) and (2006, 8.6). These points are joined to get the graph representing the given information as shown in the figure below.​
View full question & answer
Question 75 Marks
The following table gives the information regarding length of a side of a square and its area:
Length of a side (in cm): 1 2 3 4 5
Area of square (in $cm^2$): 1 4 9 16 25
Draw a graph to illustrate this information.
Answer


Here, length of a side is an independent variable and area of square is a dependent variable. So, we take length of a side on the x-axis and area of square on the y-axis.
Let us choose the following scale:
  • On x-axis: 2cm = $1cm$
  • On y-axis: 1cm = $2cm^2$
Now we plot (1, 1), (2, 4), (3, 9), (4, 16), (5, 25). These points are joined to get the graph representing the given information as shown in the figure below.​
View full question & answer
Question 85 Marks
The following table gives the information regarding the number of persons employed to a piece of work and time taken to complete the work:
Number of persons: 2 4 6 8
Time taken (in days): 12 6 4 3
Plot a graph of this information.
Answer
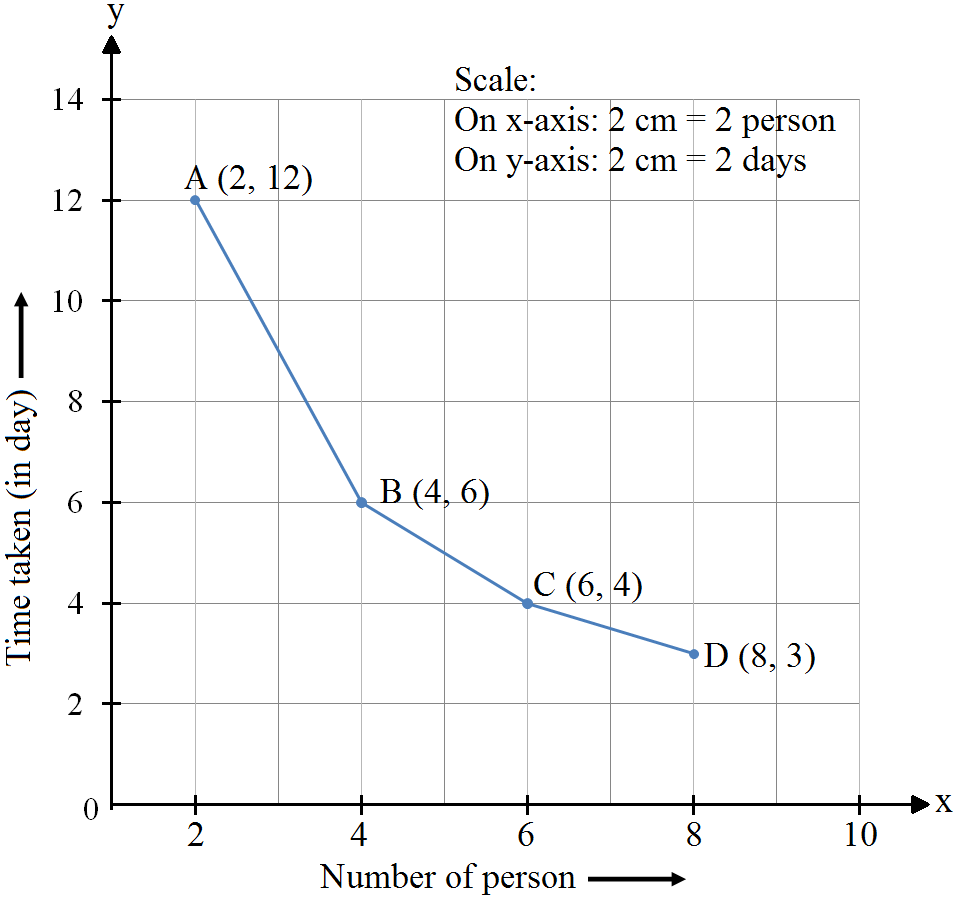
Here, number of persons is an independent variable and time taken is a dependent variable. So, we take the number of persons on the x-axis and time taken on the y-axis.Let us choose the following scale:
  • On x-axis: 2cm = 2 persons
  • On y-axis: 2cm = 2 days
Now, let us plot (2, 12), (4, 6), (6, 4), (8, 3). These points are joined to get the graph representing the given information as shown in the figure below.​
View full question & answer
Question 95 Marks
The following table shows the amount of rice grown by a farmer in different years:
Years: 2000 2001 2002 2003 2004 2005 2006
Rice grown (in quintals): 200 180 240 260 250 200 270
Answer
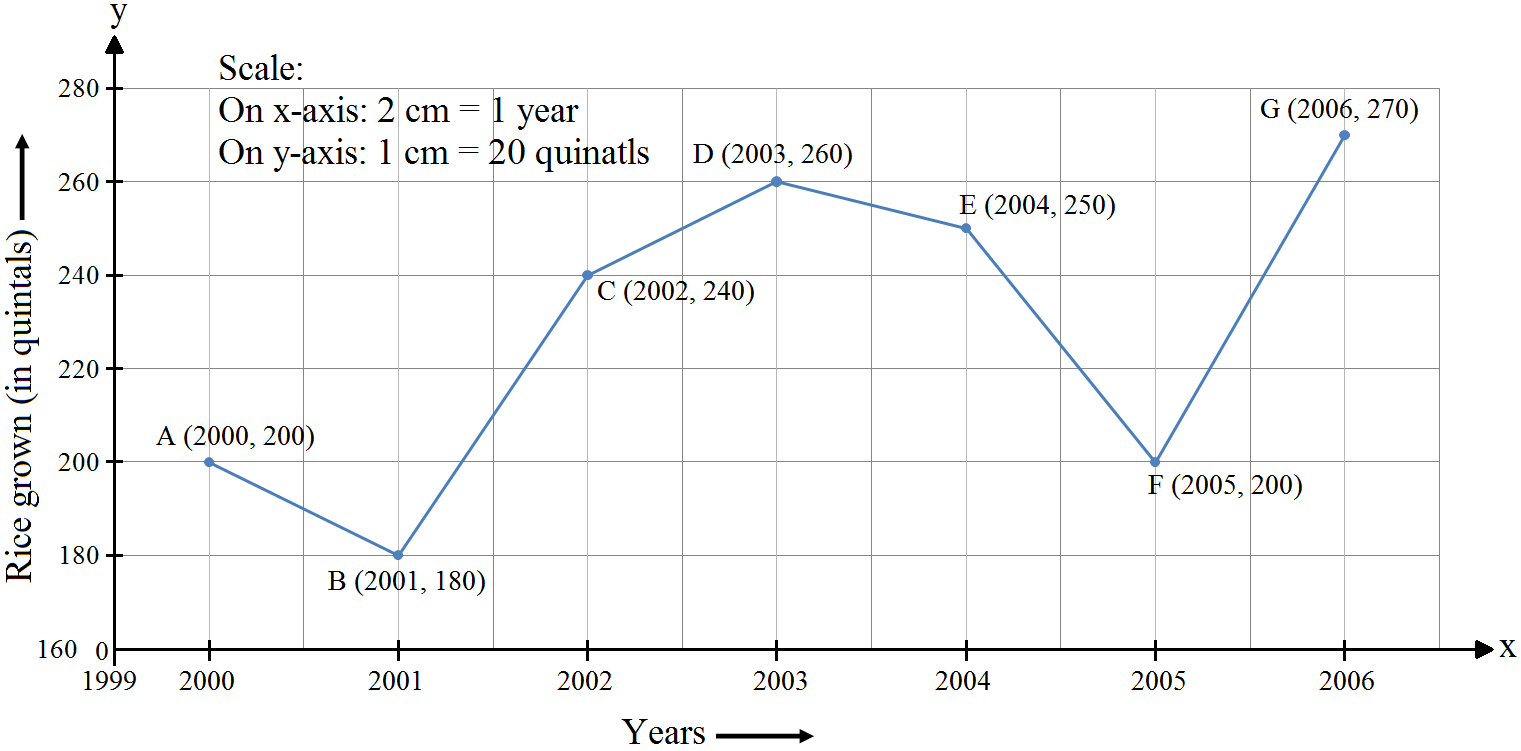
Here, year is an independent variable and quantity of rice grown is a dependent variable. So, we take years on the x-axis and quantity of rice grown on the y-axis.Let us choose the following scale:
  • On x-axis: 2cm = 1 year.
  • On y-axis: 1cm = 20 quintals.
Let us assume that the origin O represents the coordinates (1999, 160). Now, let us plot (2000, 200), (2001, 180), (2002, 240), (2003, 260), (2004, 250),(2005, 200),(2006, 270). These points are joined to get the graph representing the given information as shown in the figure below.​ ​​​​​​​
View full question & answer
Question 105 Marks
Draw the velocity-time graph from the following data:
Time (in hours): 7:00 8:00 9:00 10:00 11:00 12:00 13:00 14:00
Speed (in km/ hr): 30 45 60 50 70 50 40 45
Answer

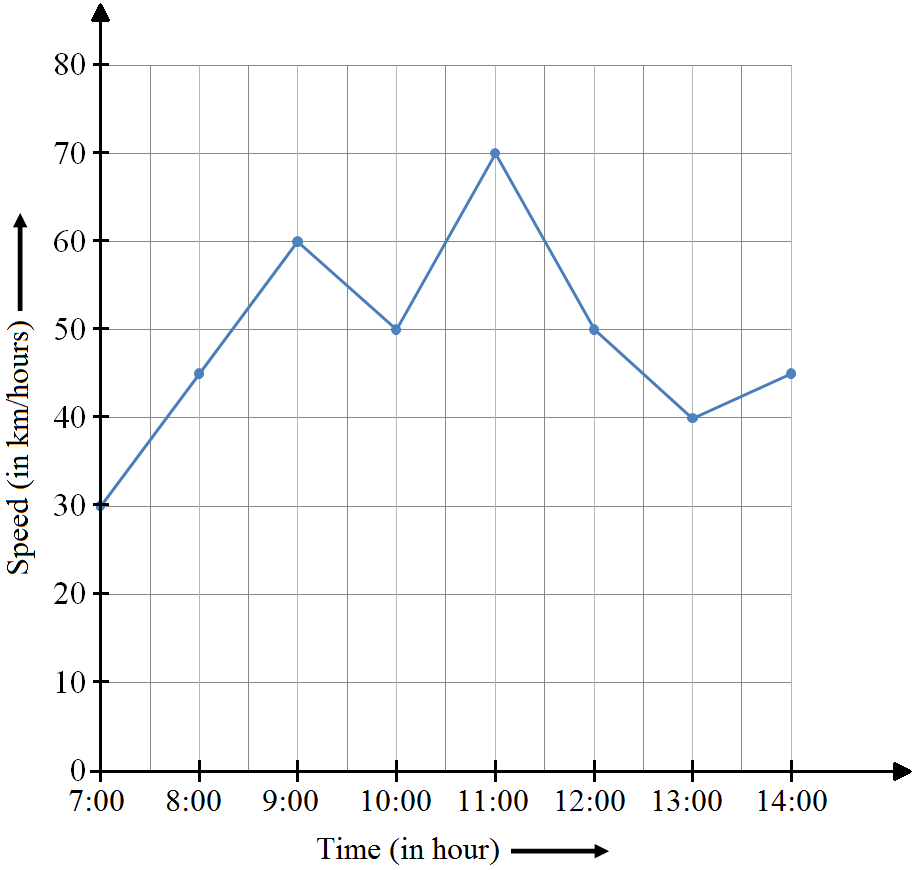
Here, time is an independent variable and speed is a dependent variable. So, we take time on the x-axis and speed on the y-axis.
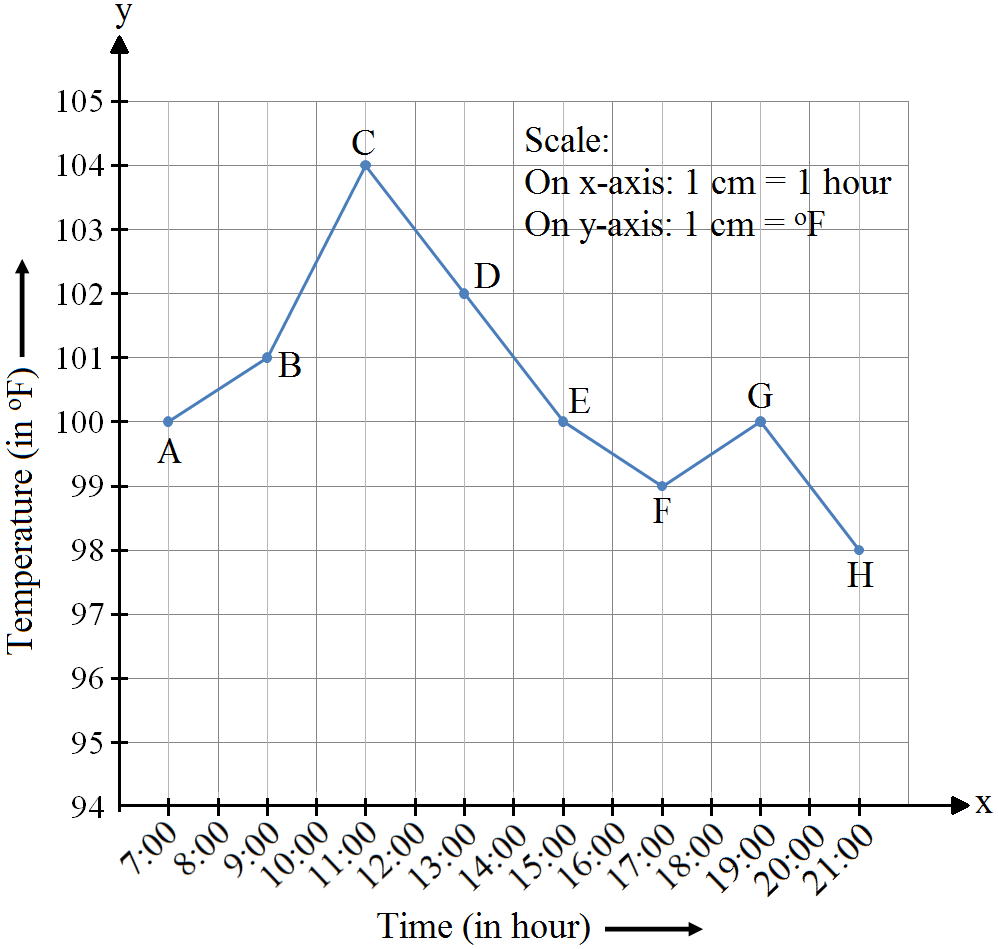
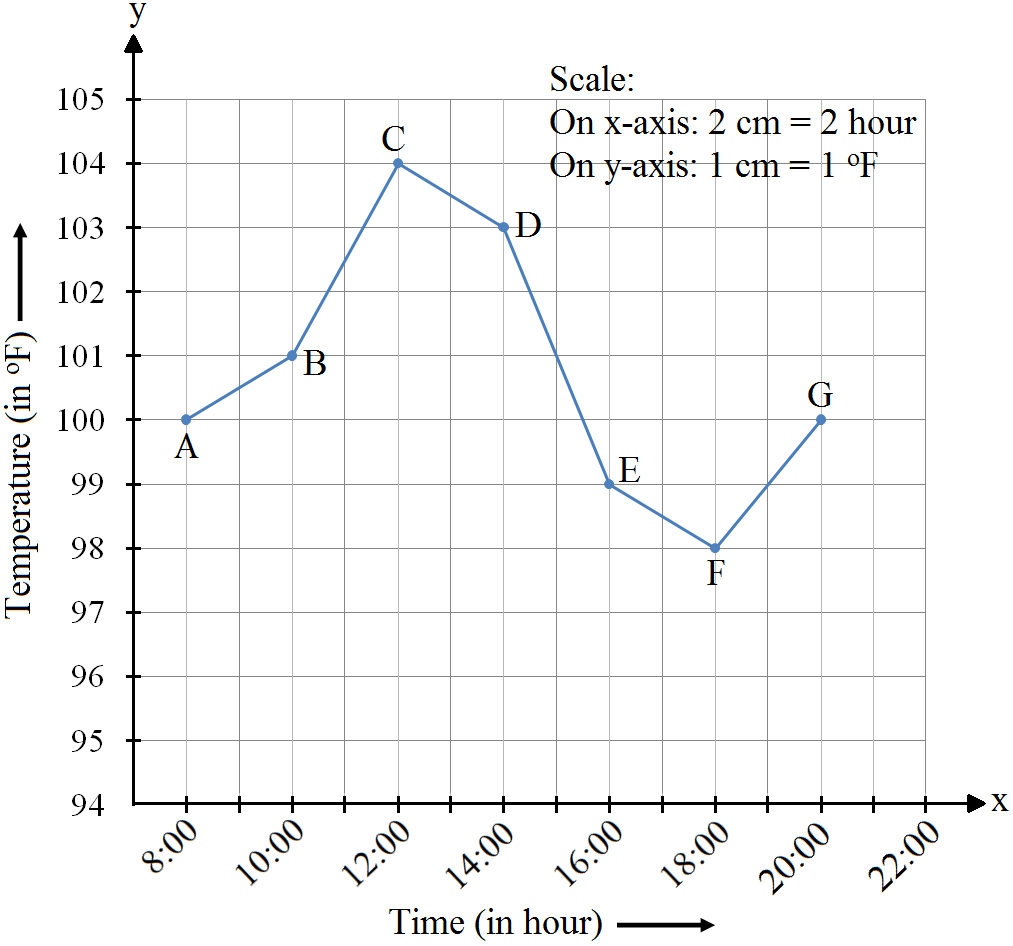
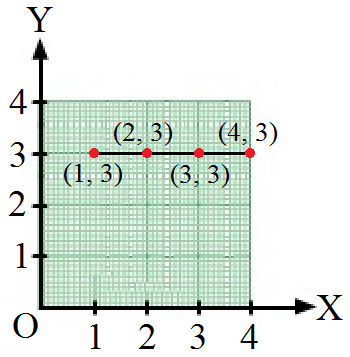
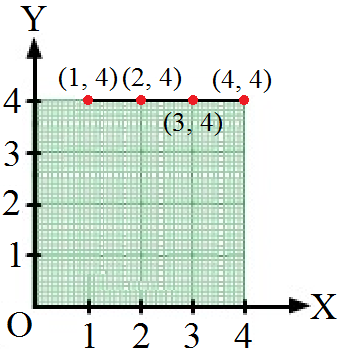
Let us choose the following scale:
  • On x-axis: 2 big division = 1 hour
  • On y-axis: 1 big division = 10 km/ hr
Let us assume that on the x-axis, the coordinate of origin (O) is 7:00.
So, the coordinates of O are (7:00,0).
Now, let us plot (7:00, 30), (8:00, 45), (9:00, 60), (10:00, 50), (11:00, 70), (12:00, 50), (13:00, 40), (14:00, 45). These points are joined to get the graph representing the given information as shown in the figure below.​
View full question & answer
Question 115 Marks
Draw the temperature-time graph in each of the following cases:
  1.  
Time (in hours): 7:00 8:00 9:00 10:00 11:00 12:00 13:00 14:00
Speed (in km/hr): 30 45 60 50 70 50 40 45
  1.  
Time (in hours): 8:00 10:00 12:00 14:00 16:00 18:00 20:00
Temperature $\left({ }^{\circ} F \right)$ in: 100 101 104 103 99 98 100
Answer
  1.  
  1.  

Here, time is an independent variable and temperature is a dependent variable. So, we take time on the x-axis and temperature on the y-axis.
Let us choose the following scale:
For point (i):
  • On x-axis: $1 cm=1$ hours
  • On y-axis: $1 cm=2^{\circ} F$
​For point (ii):
  • On x-axis: $2 cm=2$ hours
  • On y-axis: $1 cm=1^{\circ} F$
Let us assume that on the $x$-axis, the coordinate of origin is 6:00.
On $y$-axis, the coordinate of origin is $94^{\circ} F$.
So, the coordinates of $O$ are $(6: 00,94)$.
Now, let us plot $(7: 00,100),(9: 00,101),(11: 00,104), \quad(21: 00,98)$ for point
(i) and $(8: 00,100),(10: 00,101),(12: 00$, 104), __, (20:00, 100) for point
(ii). These points are joined to get the graphs representing the given information as shown in the figures below.
View full question & answer
Question 125 Marks
Write the coordinates of each of the vertices of each polygon in Figure.
Answer

From the figure:
We have:
In polygon OXYZ:
  • O lies on the origin and the coordinates of the origin are (0, 0). So, the coordinates of O are (0, 0).
  • X lies on the y-axis. So, the x-coordinate is 0. Hence, the coordinate of X is (0, 2).
  • Also, YX is equal to 2 units and YZ is equal to 2 units. So, the coordinates of vertex Y are (2, 2).
  • Z lies on the x-axis. So, the y-coordinate is 0. Hence, the coordinates of Z are (2, 0).
In polygon ABCD:
  • Draw perpendiculars DG, AH, CI and BJ from A, B, C and D on the x-axis.
  • Also, draw perpendiculars DF, AE, CF and BE from A, B, C and D on the y-axis.
  • Now, from the figure:
  • DF = 3 units and DG = 3 units
  • Therefore, the coordinates of D are (3, 3).
  • AE = 4 units and AH = 5 units
  • Therefore, the coordinates of A are (4, 5).
  • CF = 6 units and CI = 3 units
  • Therefore, the coordinates of C are (6, 3).
  • BE = 7 units and BJ = 5 units
  • Coordinates of B are (7, 5).Therefore, the c
In polygon PQR:
  • Draw perpendiculars PJ, QK and RK from P, Q and R on the x-axis.
  • Also, draw perpendiculars PW, QE and RF from P, Q and R on the y-axis.
  • Now, from the figure:
  • PW = 7 units and PJ = 4 units
  • Therefore, the coordinates of P are (7, 4).
  • QE = 9 units and QK = 5 units
  • Therefore, the coordinates of Q are (9, 5).
  • RF = 9 units and RK = 3 units
  • Therefore, the coordinates of R are (9, 3).
View full question & answer