Question 14 Marks
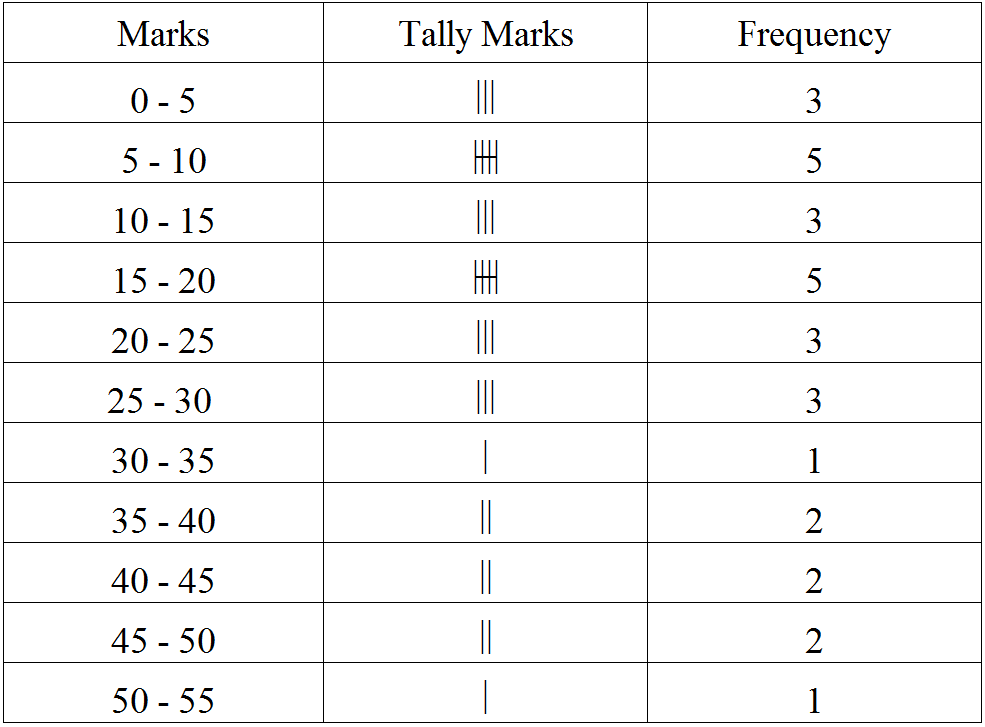
Construct a frequency table with class-intervals 0-5 (5 not included) of the following marks obtained by a group of 30 students in an examination.
0, 5, 7, 10, 12, 15, 20, 22, 25, 27, 8, 11, 17, 3, 6, 9, 17, 19, 21, 29, 31, 35, 37, 40, 42,45, 49, 4, 50, 16.
0, 5, 7, 10, 12, 15, 20, 22, 25, 27, 8, 11, 17, 3, 6, 9, 17, 19, 21, 29, 31, 35, 37, 40, 42,45, 49, 4, 50, 16.
Answer
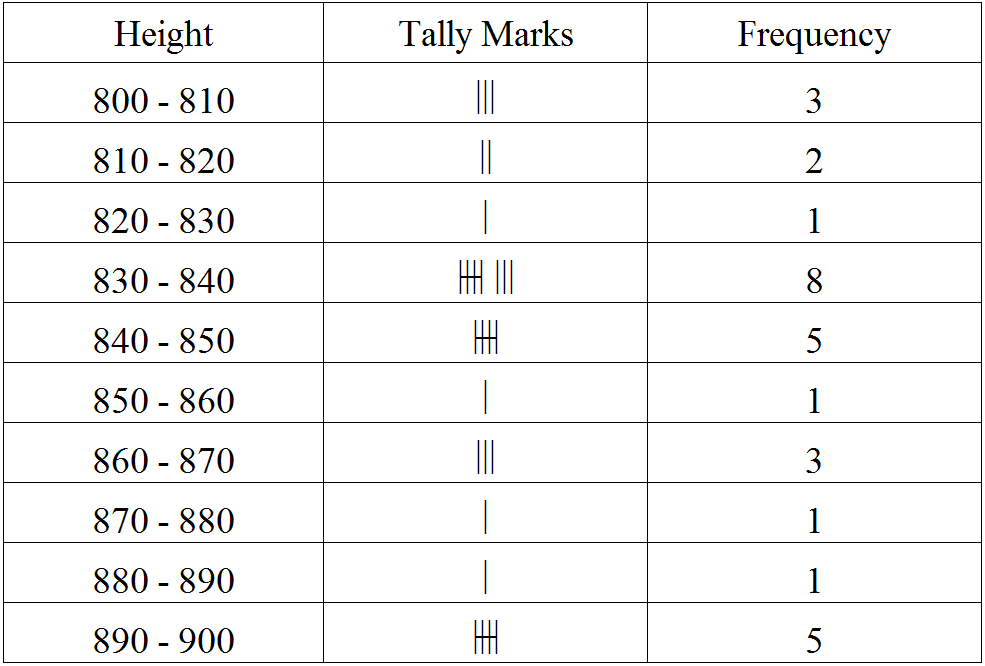
View full question & answer→The frequency table with class intervals 0-5, 5-10, 10-15, ____, 50-55 is given below: