Question 15 Marks
The monthly income of family is ₹ 28800. The monthly expenditure of the family on various items is given below.
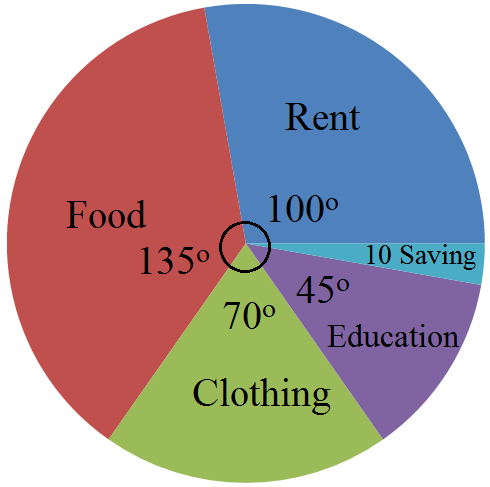
Represent the above data by a pie chart.
| Item | Rent | Food | Clothing | Education | Saving |
| Expenditure (in ₹) | 8000 | 10800 | 5600 | 3600 | 800 |
Answer
View full question & answer→Monthly income of the family = ₹ 28,800
Central angle for each item $=\Big(\frac{\text{Expenditure per month on various items}}{\text{Monthly income}}\times360\Big)^\circ$
Calculation of central angles,
Construction of pie chart:
Steps of construction-
Central angle for each item $=\Big(\frac{\text{Expenditure per month on various items}}{\text{Monthly income}}\times360\Big)^\circ$
Calculation of central angles,
| Items | Expenditure (in ₹) | Central angle |
| Rent | 8000 | 100° |
| Food | 10800 | 135° |
| Clothing | 5600 | 70° |
| Education | 3600 | 45° |
| Savings | 800 | 10° |
Steps of construction-
- Draw a circle of any convenient radius.
- Draw a horizontal radius of this circle.
- Draw sectors whose central angles are 100°, 135°, 70°, 45° and 10°.
- Shade the sectors so obtained differently and label each one of them.