Report writing
Question types
Geography ch 1 - Distributional Maps question types
53 questions across 8 question groups — pick any mix to generate a Social Studies paper with step-by-step answer keys.
53
Questions
8
Question groups
5
Question types
01
Write the following concept
4 Q→02Answer in brief
3 Q→03MCQ
10 Q→04Give reasons why the following sentences are right or wrong
8 Q→05Answer the question
14 Q→06Explain which method will you use for the following information
7 Q→07Match the column.
2 Q→08Read the map given below and answer the Questions
5 Q→Sample Questions
Geography ch 1 - Distributional Maps questions
One sample from each question group in this chapter. Select any group above to see the full set with answer keys.
View full solution →
Selection of the study area
Preparations for field visit
Choropleth method
Explain with reasons the method which is best suited to show the distribution of population in a region.
Differentiate between choropleth and isopleths methods.
Explain the use and types of distributional maps.
is an important study method in Geography.
- AMaps
- ✓Field visit
- CPicnic
- Dfarm visit
Answer: B.
View full solution →While showing population distribution, urban population is shown by
- ✓circles
- Bdots
- Csquares
- Dlines
Answer: A.
View full solution →When the distribution of a variable is the isopleth method is used.
- ✓continuous
- Bdiscontinuous
- Csparse
- Ddisjoint
Answer: A.
View full solution →In method, lines showing equal values are used.
- Achoropleth
- ✓isopleth
- Cdot
- Dplanar
Answer: B.
View full solution →When the distribution of a variable is discontinuous the map is used.
- Aisopleth
- Bphysical
- ✓choropleth
- Ddot
Answer: C.
View full solution →Distribution of various geographical elements can be shown using dot method.
Isopleth maps are not made using isolines.
In dot method, every dot should have an appropriate scale.
Isopleth maps are used to show population distribution.
Choropleth maps are used to show altitudes.
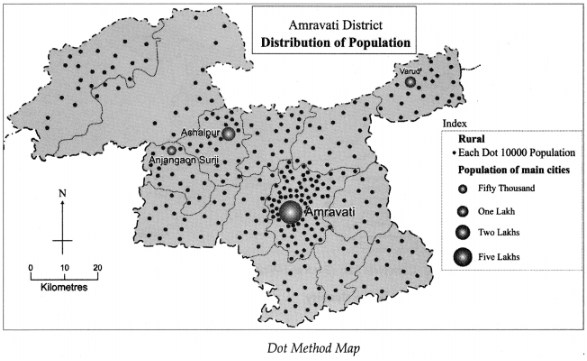
Which Taluka has the least population?
What is the population shown by the largest circle? Which place is that?
Explain the direction wise distribution of the population from dense to sparse.
Which method has been used to show the distribution of population in the district?
What is field report?
Cotton crop distribution in Maharashtra.
The distribution of rainfall in the district of Nandurbar.
Temperature distribution in Maharashtra State.
The distribution of population density in India
Distribution of domestic animals in the State
| Group A | Group A |
| (1) Dot method (2) Choropleth method (3) Isopleth method | (a) variables are freely scattered (b) distribution of the variable is continuous (c) distribution of the variable is shown in sub administrative unit |
| Group A | Group B |
| (1) Dot method | (a) distribution of temperature |
| (2) Choropleth method | (b) distribution of cotton crop |
| (3) Isopleth method | (c) density of population |
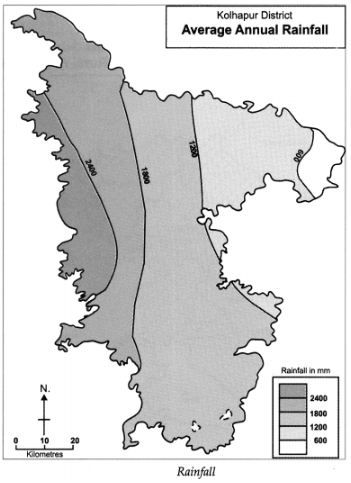
1.In which direction is the rainfall more in the district?
2.In which direction is the rainfall decreasing?
3.Which class shows low rainfall category in the district?
4.Which class shows high rainfall category in the district?
5.Which class shows high rainfall category in the district?
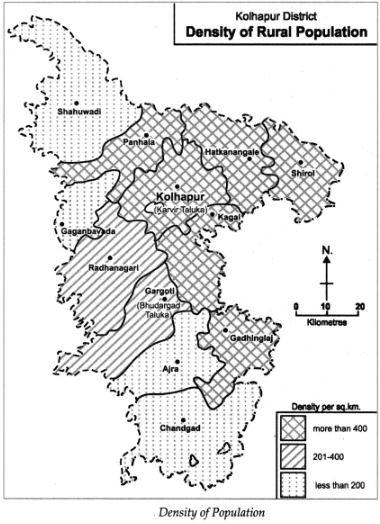
1.In which direction is the density of population decreasing?
2.Name the talukas with a population density less than 200.
3.Name the talukas having population density between 200 and 400.
4.Name the talukas with a population density more than 400.
5.In which direction are the talukas having a higher density of population located in the district?
6.Which method has been used in the making of this map?
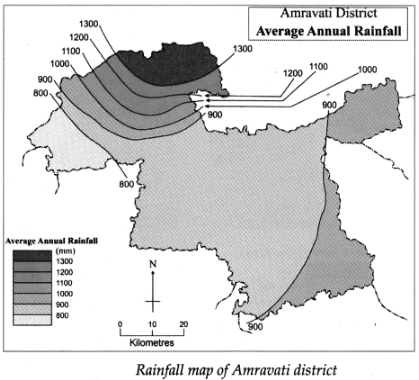
1.In which part of the district is the rainfall more?
2.In which direction is the rainfall decreasing?
3.What is the lowest value of the rainfall in the district?
4.What is the highest value of the rainfall in the district?
5.What is the amount of rainfall in the central part of the district?
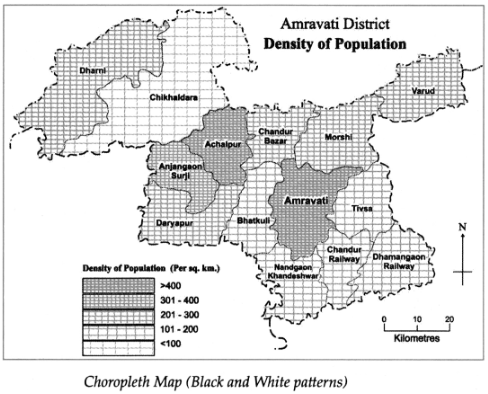
1.Name the talukas having population density between 301 and 400 persons per sq km.
2.What is the density of the Amravati taluka?
3.Name the talukas having population density less than 300 persons per sq km.
4.Which taluka has a population density of less than 100 persons per sq km?
5.Which Talukas have a population density of more than 400 persons per sq km?
1.What is the population of the Amravati town?
2.Name the place having population of 1 lakh on the map.
3.Which part of the map shows sparse distribution of population?
Generate a Geography ch 1 - Distributional Maps paper free
Pick question groups from the list above, set marks and difficulty, and export a branded PDF with step-by-step answer keys. First 3 chapters free — no signup.