Question 12 Marks
Following is the distribution of marks of 70 students in a periodical test:
Draw a cumulative frequency for the above data.
|
Marks
|
Less than 10
|
Less than 20
|
Less than 30
|
Less than 40
|
Less than 50
|
|
Number of students
|
3
|
11
|
28
|
48
|
70
|
Answer
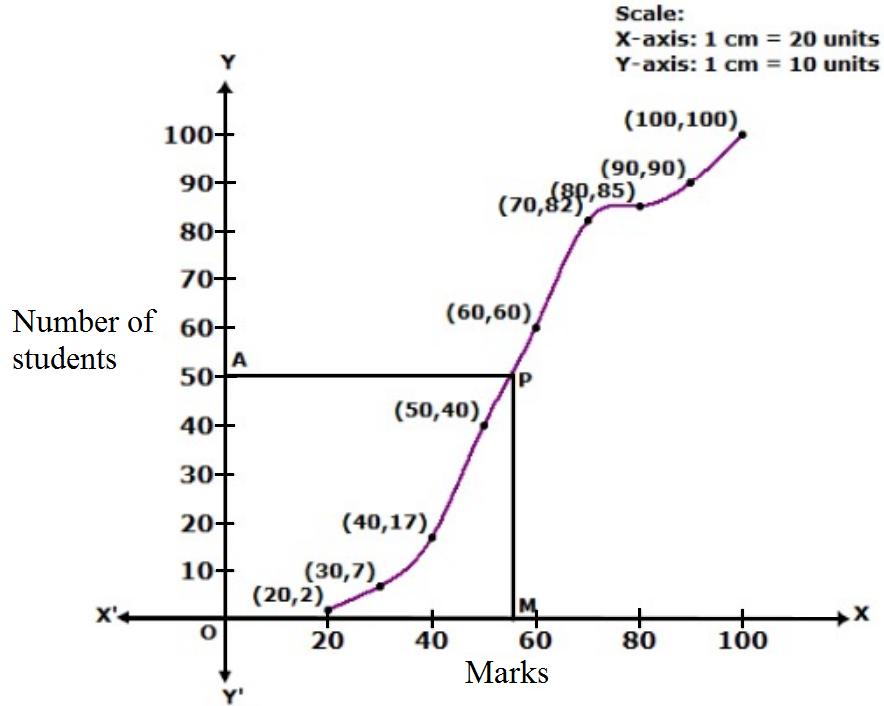
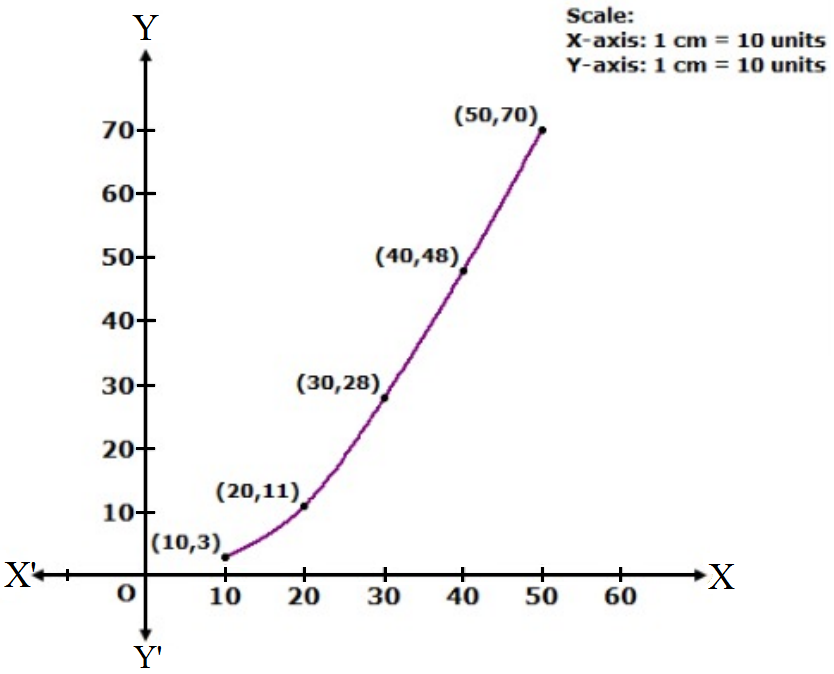
We plot the points (10,3), (20,11), (30,28), (40,48) and (50,70). to get the cumulative frequency curve as follows:
View full question & answer→|
Marks
|
Less than 10
|
Less than 20
|
Less than 30
|
Less than 40
|
Less than 50
|
|
Number of students
|
3
|
11
|
28
|
48
|
70
|