Question 13 Marks
The final marks in mathematics of $30$ students are as follows: $53, 61, 48, 60, 78, 68, 55, 100, 67, 90 75, 88, 77, 37, 84, 58, 60, 48,$$ 62, 56 44, 58, 52, 64, 98, 59, 70, 39, 50, 60$ Arrange these marks in the ascending order $30$ to $39$ one group, $40$ to $49$ second group, etc.
AnswerFrequency distribution of the given marks in mathematics of $30$ students,
|
$30-39$
|
$37, 39$
|
|
$40-49$
|
$44, 48, 48$
|
|
$50-59$
|
$50, 52, 53, 55, 56, 58, 58, 59$
|
|
$60-69$
|
$60, 60, 60, 61, 62, 64, 67, 68$
|
|
$70-79$
|
$70, 75, 77, 78$
|
|
$80-89$
|
$84, 88$
|
|
$90-99$
|
$90, 98$
|
|
$100-109$
|
$100$
|
View full question & answer→Question 23 Marks
Prepare a frequency table of the following scores obtained by $50$ students in a test: $42, 51, 21, 42, 37, 37, 42, 49, 38, 52, 7, 33, 17, $$44, 39, 7, 14, 27, 39, 42, 42, 62, 37, 39, 67, 51, 53, 53, 59, 41, 29, 38,$ $27, 31, 54, 19, 53, 51, 22, 61, 42, 39, 59, 47, 33, 34, 16, 37, 57, 43$
AnswerFrequency distribution table of the given scores:
|
Marks
|
Tally marks
|
Frequency
|
|
$7$
|
$II$
|
$2$
|
|
$14$
|
$I$
|
$1$
|
|
$16$
|
$I$
|
$1$
|
|
$17$
|
$I$
|
$1$
|
|
$19$
|
$I$
|
$1$
|
|
$21$
|
$I$
|
$1$
|
|
$22$
|
$I$
|
$1$
|
|
$27$
|
$II$
|
$2$
|
|
$29$
|
$I$
|
$1$
|
|
$31$
|
$I$
|
$1$
|
|
$33$
|
$II$
|
$2$
|
|
$34$
|
$I$
|
$1$
|
|
$37$
|
$IIII$
|
$4$
|
|
$38$
|
$II$
|
$2$
|
|
$39$
|
$IIII$
|
$4$
|
|
$41$
|
$I$
|
$1$
|
|
$42$
|
$IIII I$
|
$6$
|
|
$43$
|
$I$
|
$1$
|
|
$44$
|
$I$
|
$1$
|
|
$47$
|
$I$
|
$1$
|
|
$49$
|
$I$
|
$1$
|
|
$51$
|
$III$
|
$3$
|
|
$52$
|
$I$
|
$1$
|
|
$53$
|
$III$
|
$3$
|
|
$54$
|
$I$
|
$1$
|
|
$57$
|
$I$
|
$1$
|
|
$59$
|
$II$
|
$2$
|
|
$61$
|
$I$
|
$1$
|
|
$62$
|
$I$
|
$1$
|
|
$67$
|
$I$
|
$1$
|
View full question & answer→Question 33 Marks
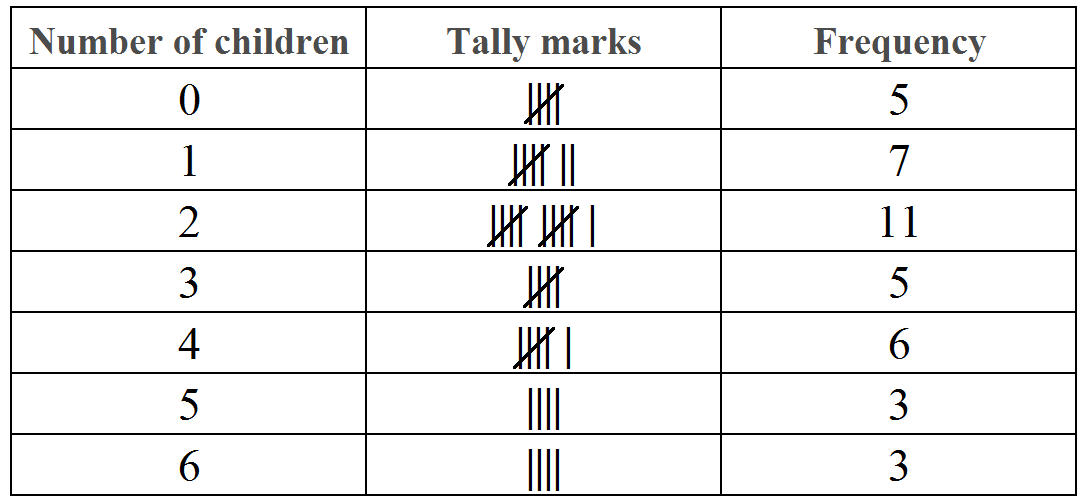
Following data gives the number of children in $40$ families: $1, 2, 6, 5, 1, 5, 1, 3, 2, 6, 2, 3, 4, 2, 0, 0, 4, 4, 3, 2 2, 0, 0, 1, 2, 2, 4, 3, 2,$ $1, 0, 5, 1, 2, 4, 3, 4, 1, 6, 2$ Represent it in the form of a frequency distribution.
AnswerFrequency distribution of the given data:
View full question & answer→Question 43 Marks
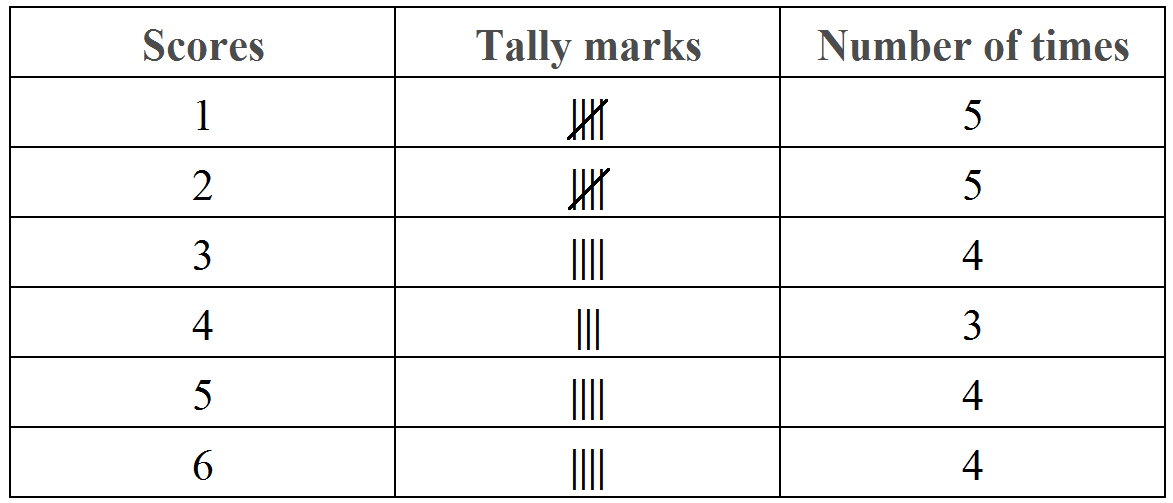
A die was thrown $25$ times and following scores were obtained:
|
$1$
|
$5$
|
$2$
|
$4$
|
$3$
|
|
$6$
|
$1$
|
$4$
|
$2$
|
$5$
|
|
$1$
|
$6$
|
$2$
|
$6$
|
$3$
|
|
$5$
|
$4$
|
$1$
|
$3$
|
$2$
|
|
$3$
|
$6$
|
$1$
|
$5$
|
$2$
|
Prepare a frequency distribution table. AnswerFrequency distribution table of the given scores:
View full question & answer→Question 53 Marks
Following is the choice of sweets of $30$ students of class VI: Ladoo, Barfi, Ladoo, Jalebi, Ladoo, Rasgulla, Jalebi, Ladoo, Barfi, Rasgulla, Ladoo, Jalebi, Jalebi, Rasgulla, Ladoo, Rasgulla, Jalebi, Ladoo, Rasgulla, Ladoo, Rasgulla, Jalebi, Ladoo, Rasgulla, Ladoo, Ladoo, Barfi, Rasgulla, Rasgulla, Ladoo.
$i.\ $Arrange the names of sweets in a table using tally marks.
$ii.\ $Which sweet is preferred by most of the students?
Answer$i.\ $Frequency distribution of the given sweets:
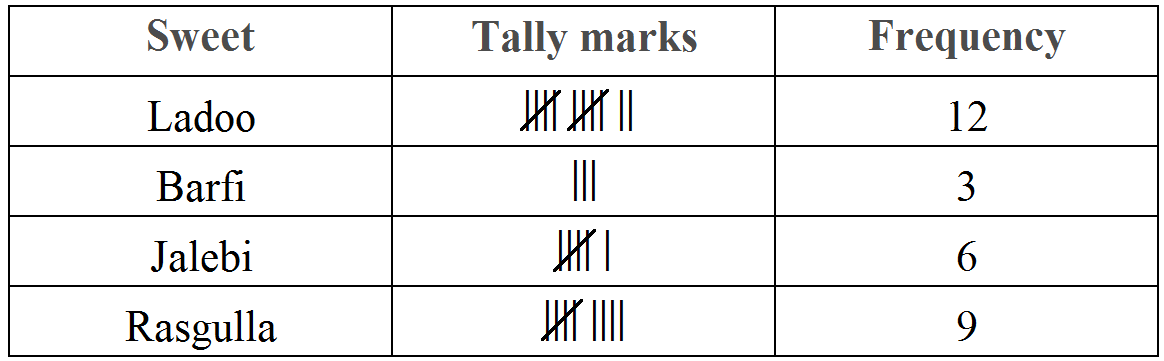
$ii.\ $The frequency of Ladoo is $12$ i.e. maximum.
Therefore, Ladoo is the sweet that is preferred by most of the students. View full question & answer→Question 63 Marks
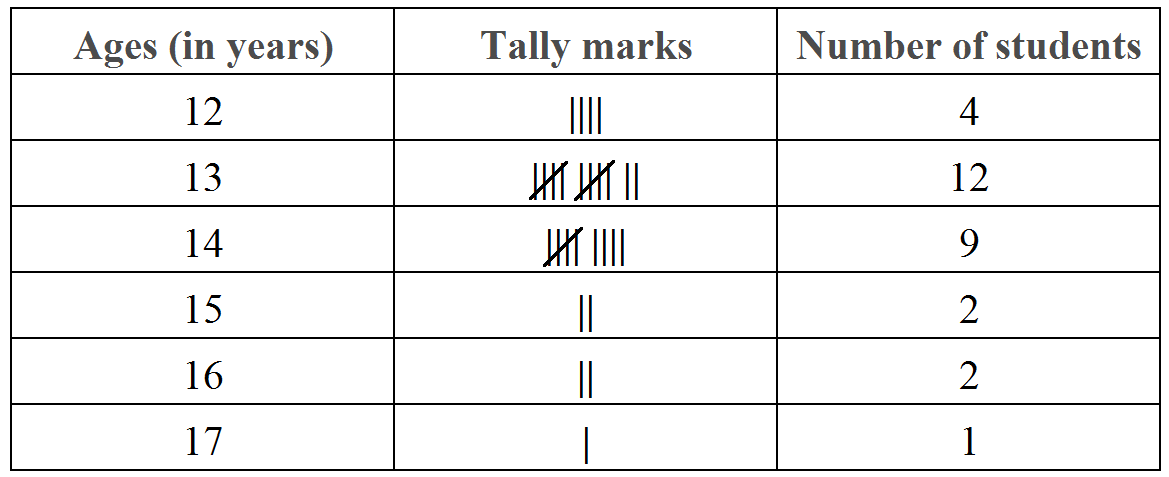
Prepare a frequency table of the following ages (in years) of $30$ students of class $VIII$ in your school: $13, 14, 13, 12, 14, 13, 14, 15, 13, 14,$ $13, 14, 16, 12, 14 13, 14, 15, 16, 13, 14, 13, 12, 17, 13, 12, 13, 13, 13, 14$
AnswerFrequency distribution table of the given ages (in years) of $30$ students:
View full question & answer→Question 73 Marks
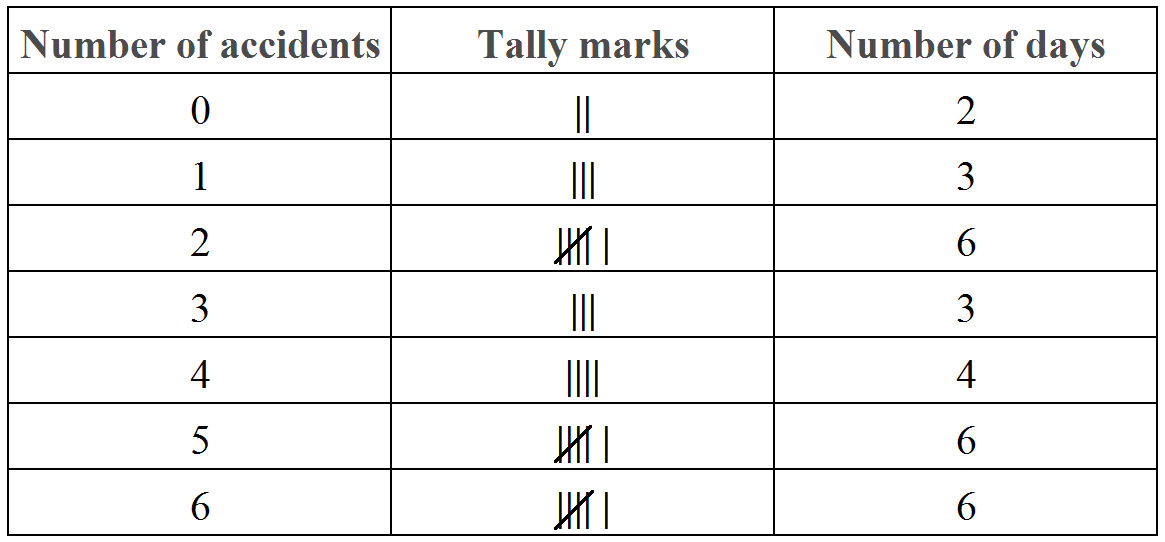
In a study of number of accidents per day, the observations for $30$ days were obtained as follows$: 6, 3, 5, 6, 4, 3, 2, 5, 4, 2, 4, 2, 1, 2, 2,$ $0, 5, 4, 6, 1, 6, 0, 5, 3, 6, 1, 5, 5, 2, 6.$ Prepare a frequency distribution table.
AnswerFrequency distribution table of the given number of accidents per day is given below:
View full question & answer→