Question 14 Marks
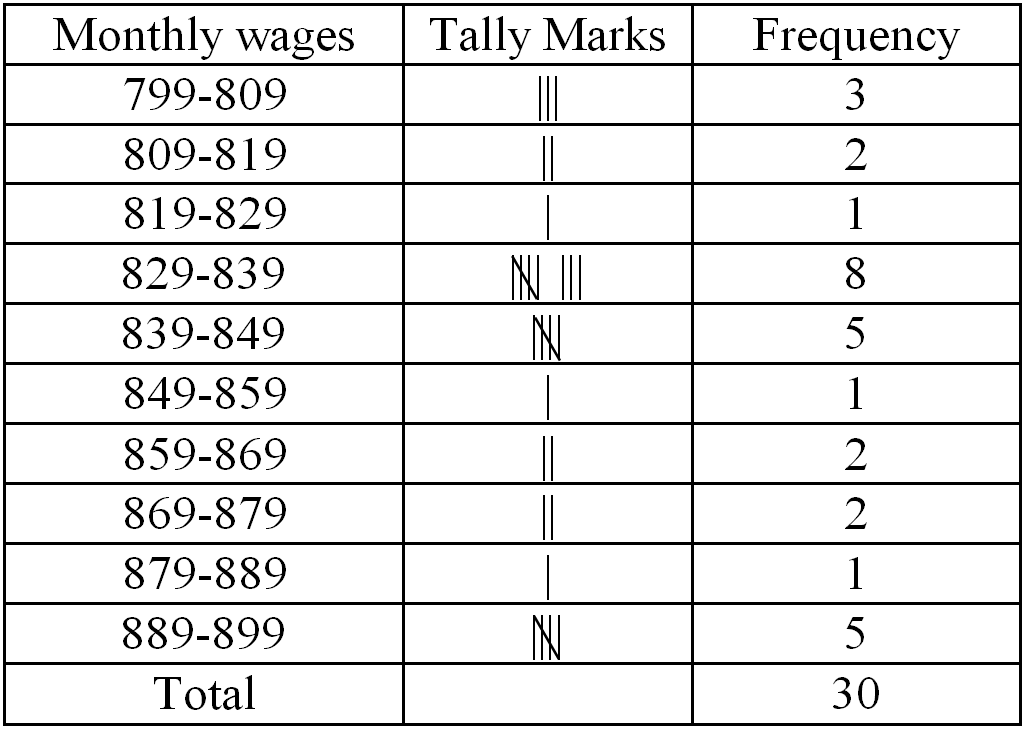
The monthly wages of $30$ workers in a factory are given below: $83.0, 835, 890, 810, 835, 836, 869, 845, 898, 890, 820, 860, 832, 833, 855, 845, 804, 808, 812, 840, 885, 835, 836, 878, 840, 868, 890, 806, 840, 890$. Represent the data in the form of a frequency distribution with class size $10$.
AnswerHere, the maximum and minimum values of the variate are $898$ and $804$ respectively.
So the range $= 898 - 804 = 94$ Here, we will take class size $10$.
So we must have $\frac{94}{10}$ i.e. $10$ classes each of size $10$.
Therefore, the frequency distribution in which the lower limit is included and upper limit excluded is:
Lower limit of first class interval is; $\text{a}-\frac{\text{h}}{2}=804-\frac{10}{2}=799$ And upper limit of first class interval is:
$\text{a}+\frac{\text{h}}{2}=804+\frac{10}{2}=809$ Other class limits are:
View full question & answer→Question 24 Marks
Write the class size and class limits in the following: $12.5, 17.5, 22.5, 27.5, 32.5, 37.5, 42.5, 47.5$.
Answer$12.5, 17.5, 22.5, 27.5, 32.5, 37.5, 42.5, 47.5.$ Class size $= 17.5 - 12.5 = 5$
|
Class Mark
|
Lower Class Limit
|
Upper Class Limit
|
Class Limit
|
|
$12.5$
|
$12.5 - 2.5 = 10$
|
$12.5 + 2.5 = 15$
|
$15$-Oct
|
|
$17.5$
|
$17.5 - 2.5 = 15$
|
$17.5 + 2.5 = 20$
|
$15-20$
|
|
$22.5$
|
$22.5 - 2.5 = 20$
|
$22.5 + 2.5 = 25$
|
$20-25$
|
|
$27.5$
|
$27.5 - 2.5 = 25$
|
$27.5 + 2.5 = 30$
|
$25-30$
|
|
$32.5$$$
|
$32.5 - 2.5 = 30$
|
$32.5 + 2.5 = 35$
|
$30-35$
|
|
$37.5$
|
$37.5 - 2.5 = 35$
|
$37.5 + 2.5 = 40$
|
$35-40$
|
|
$42.5$
|
$42.5 - 2.5 = 40$
|
$42.5 + 2.5 = 45$
|
$40-45$
|
|
$47.5$
|
$47.5 - 2.5 = 45$
|
$47.5 + 2.5 = 50$
|
$45-50$
|
View full question & answer→Question 34 Marks
The number of runs scored by a cricket player in $25$ innings is as follows$: \ 26, 35, 94, 48, 82, 105, 53, 0, 39, 42, 71, 0, 64, 15, 34, $$15, 34, 6, 71, 0, 64, 15, 34, 15, 34, 67, 0, 42, 124, 84, 54, 48, 139, 64, 47$
$i.$ Rearrange these runs in ascending order.
$ii.$ Determine the player, is highest score.
$iii.$ How many times did the player not score a run?
$iv.$ How many centuries did he score?
$v.$ How many times did he score more than $50$ runs?
AnswerThe numbers of runs scored by a player in $25$ innings are$: \ 26, 35, 94, 48, 82, 105, 53, 0, 39, 42, 71, 0, 64, 15, 34, 15,$$ 34, 6, 71, 0, 64, 15, 34, 15, 34, 67, 0, 42, 124, 84, 54, 48, 139, 64, 47.$
$i.$ Runs in an ascending order are$:\ 0, 0, 0, 0, 6, 15, 15, 15, 15, 26, 34, 34, 34, 34, 35, 39, 42, $$42, 47, 48, 48, 53, 54, 64, 64, 64, 67, 71, 71, 82, 90, 124, 139.$
$ii.$ The highest number $= 139$
$iii.$ The player did not score any runs $3$ times.
$iv.$ He scored $3$ centuries.
$v.$ He scored more than $50$ runs $12$ times.
View full question & answer→Question 44 Marks
Given below is a cumulative frequency distribution table showing ages of the people living in a locality:
|
Age in years
|
No. of years
|
|
Above $108$
|
$0$
|
|
Above $96$
|
$1$
|
|
Above $84$
|
$3$
|
|
Above $72$
|
$5$
|
|
Above $60$
|
$20$
|
|
Above $48$
|
$158$
|
|
Above $36$
|
$427$
|
|
Above $24$
|
$809$
|
|
Above $12$
|
$1026$
|
|
Above $0$
|
$1124$
|
Prepare a frequency distribution table. Answer
|
Age (in years)
|
No. of persons
|
Class interval
|
Frequency
|
|
Above $0$
|
$1124$
|
$0-12$
|
$1124 - 1026 = 98$
|
|
Above $12$
|
$1026$
|
$12-24$
|
$217$
|
|
Above $24$
|
$809$
|
$24-36$
|
$382$
|
|
Above $36$
|
$427$
|
$36-48$
|
$269$
|
|
Above $38$
|
$158$
|
$48-60$
|
$138$
|
|
Above $60$
|
$20$
|
$60-72$
|
$15$
|
|
Above $72$
|
$5$
|
$72-84$
|
$5 - 3 = 2$
|
|
Above $84$
|
$3$
|
$84-96$
|
$3 - 1 = 2$
|
|
Above $96$
|
$3$
|
$96-108$
|
$1 - 0 = 1$
|
View full question & answer→Question 54 Marks
The final marks in mathematics of $30$ students are as follows$:\ 53, 61, 48, 60, 78, 68, 55, 100, 67, 90, 75, 88, 77, 37, 84, 58, 60, 48, 62, 56, 44, 58, 52, 64, 98, 59, 70, 39, 50, 60$
$i.$ Arrange these marks in ascending order $30$ to $39$ one group $40$ to $49$ second group etc.
Now answer the following:
$ii.$ What is the lowest score?
$iii.$ What is the highest score?
$iv.$ What is the range?
$v.$ If $40$ is the pass mark how many failed?
$vi.$ How many have scored $75$ or more?
$vii.$ Which observations between $50$ and $60$ have not actually appeared?
$vii.$ How many have scored less than $50$?
AnswerThe final marks in mathematics of $30$ students are as follows$: \ 53, 61, 48, 60, 78, 68, 55, 100, 67, 0, 75, 88, 77, 37, 84, 58, 60, 48, 62, 56, 44, 58, 52, 64, 98, 59, 70, 39, 50, 60.$
$i. $
| $Group$ |
$Class$ |
$Observations$ |
| $$I$$ |
$$30-39$$ |
$$37, 39$$ |
| $$II$$ |
$$40-49$$ |
$$44, 48, 48$$ |
| $$III$$ |
$$50-59$$ |
$$50, 52, 53, 55, 56, 58, 58, 59$$ |
| $$IV$$ |
$$60-69$$ |
$$60, 60, 60, 61, 62, 64, 67, 68$$ |
| $$V$$ |
$$70-79$$ |
$$70, 55, 77, 78$$ |
| $$VI$$ |
$$80-89$$ |
$$84, 88$$ |
| $$VII$$ |
$$90-99$$ |
$$90, 98$$ |
| $$VIII$$ |
$$100-109$$ |
$$100$$ |
$ii.$ Highest score $= 100$
$iii.$ Lowest score $= 37$
$iv.$ Range $= 100 - 37 = 63$
$v.$ If $40$ is the passing marks $2$ students have failed.
$vi. 8$ students have scored $75$ or more.
$vii.$ Observation $51, 54, 57$ between $50$ and $60$ has not actually appeared.
$vii.5$ students have scored less than $50$ View full question & answer→Question 64 Marks
The number of books in different shelves of a library is as follows:
$30, 32, 28, 24, 20, 25, 38, 37, 40, 45, 16, 20$
$19, 24, 27, 30, 32, 34, 35, 42, 27, 28, 19, 34$
$38, 39, 42, 29, 24, 27, 22, 29, 31, 19, 27, 25$
$28, 23, 24, 32, 34, 18, 27, 25, 37, 31, 24, 23$
$43, 32, 28, 31, 24, 23, 26, 36, 32, 29, 28, 21$
Prepare a cumulative frequency distribution table using $45 - 49$ as the last class-interval. AnswerThe minimum number of bookshelves is $16$ and maximum number of bookshelves is $45$ Range = Maximum book shelves-Minimum book shelves $= 45 - 16 = 29$ Given, class interval is $45 - 49.$
So, class size $= 49 - 45 = 4$
Therefore number of classes $=\frac{\text{Range}}{\text{Class size}}= \frac{29}{4} = 7.25$
Number of classes $= 8$ The cumulative frequency distribution is as follows:
|
No of Books
|
No. of Shelves (Frequency)
|
Cumulative Frequency
|
|
$13-17$
|
$1$
|
$1$
|
|
$17-21$
|
$6$
|
$7$
|
|
$21-25$
|
$11$
|
$18$
|
|
$25-29$
|
$15$
|
$33$
|
|
$29-33$
|
$12$
|
$45$
|
|
$33-37$
|
$5$
|
$50$
|
|
$37-41$
|
$6$
|
$56$
|
|
$41-45$
|
$3$
|
$59$
|
|
$45-49$
|
$1$
|
$60$
|
View full question & answer→Question 74 Marks
The daily minimum temperatures in degrees Celsius recorded in a certain arctic region are as follows:
$-12.5, -10.8, -18.6, -8.4, -10.8, -4.2, -4.8, -6.7, -13.2, -11.8, -2.3, 1.2, 2.6, 0, -2.4, 0, 3.2, 2.7, 3.4, 0, -2.4, -2.4, 0, 3.2, 2.7, 3.4, 0, -2.4, -5.8, -8.9, -14.6, -12.3, -11.5, -7.8, -2.9.$
Represent them as frequency distribution table taking $-19.9$ to $-15$ as the first class interval.
AnswerSince the first class is $-19.9$ to $-15$ Therefore, the frequency distribution in which the lower limit is included and upper limit excluded is: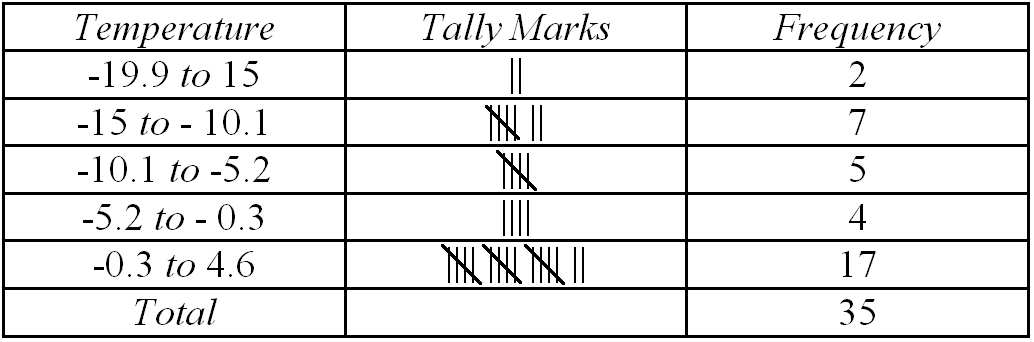
View full question & answer→Question 84 Marks
Thirty children were asked about the number of hours they watched $TV$ programes in the previous week.
The results were found as follows$:\ 1, 6, 2, 3, 5, 12, 5, 8, 4, 8, 10, 3, 4, 12, 2, 8, 15, 1, 17, 6, 3, 2, 8, 5, 9, 6, 8, 7, 14, 2$
$i.$ Make a frequency distribution table for this data, taking class width $5$ and one of the class intervals as $5-10$.
$ii.$ How many children watched television for $15$ or more hours a week.
Answer$i.$ Class intervals will be $0-5, 5-10, 10-15…$
The grouped frequency distribution table is as follows:
| Hours |
Number of children |
| $0-5$ |
$10$ |
| $5-10$ |
$13$ |
| $10-15$ |
$5$ |
| $15-20$ |
$2$ |
| Total |
$30$ |
$ii.$ The number of children who watched $TV$ for $15$ or more hours a week is $2$
$($i.e number of children in class interval $15-20)$. View full question & answer→Question 94 Marks
The weights of new born babies are as follows$: \ 2.3, 2.2, 2.1, 2.7, 2.6, 2.5, 3.0, 2.8, 2.8, 2.9, 3.1, 2.5, 2.8, 2.7, 2.9, 2.4$.
$i.$ Rearrange the weights in descending order.
$ii.$ What is the highest weight?
$iii.$ What is the lowest weight?
$iv.$ Determine the range?
$v.$ How many babies were born on that day?
$vi.$ How many babies weigh below $2.5\ Kg$?
$vii.$ How many babies weigh more than $2.8\ Kg$?
$viii.$ How many babies weigh $2.8\ Kg$?
AnswerThe weights of new born babies $($in $\ kg)$ are as follows$: \ 2.3, 2.2, 2.1, 2.7, 2.6, 2.5, 3.0, 2.8, 2.8, 2.9, 3.1, 2.5, 2.8, 2.7, 2.9, 2.4.$
$i.$ The weights in descending order
$3.1, 3.0, 2.9, 2.9, 2.8, 2.8, 2.7, 2.7, 2.6, 2.5, 2.5, 2.4, 2.3, 2.2, 2.1.$
$ii.$ The highest weight $= 3.1\ Kg$
$iii.$ The lowest weight $= 2.1\ Kg$
$iv.$ Range $= 3.1 - 2.1 = 1.0\ Kg$
$v. 15$ babies were born on that particular day.
$vi. 4$ babies weight below $2.5\ Kg$.
$vii.$ Weight more than $2.8\ Kg$ are $4$ babies.
$viii.$ Weight $2$ babies.
View full question & answer→Question 104 Marks
Heights (in cm) of $30$ students of class $IX$ are given below: $155, 158, 154, 158, 160, 148, 149, 150, 153, 159, 161, 148, 157, 153, 157, 162, 159, 151, 154, 156, 152, 156, 160, 152, 147, 155, 163, 155, 157, 153$. Prepare a frequency distribution table with $160-164$ as one of the class intervals.
Answer
|
Height (in cm)
|
Tally marks
|
Frequency
|
|
$800-810$
|
$|||$
|
$3$
|
|
$810-820$
|
$||$
|
$2$
|
|
$820-830$
|
$||$
|
$1$
|
|
$830-840$
|
$|||| |||$
|
$8$
|
| $840-850$ |
$||||$
|
$5$
|
|
$850-860$
|
$|$
|
$1$
|
|
$860-870$
|
$|||$
|
$3$
|
|
$870-880$
|
$|$
|
$1$
|
|
$880-890$
|
$|$
|
$1$
|
|
$890-900$
|
$||||$
|
$5$
|
|
|
|
Total $= 30$
|
View full question & answer→Question 114 Marks
Write the class size and class limits in the following: $104, 114, 124, 134, 144, 154$ and $164$.
Answer$104, 114, 124, 134, 144, 154$ and $164$. Class size $= 114 - 104 = 10$
|
Class Mark
|
Lower Class Limit
|
Upper Class Limit
|
Class Limit
|
|
$104$
|
$99$
|
$109$
|
$99-109$
|
|
$114$
|
$109$
|
$119$
|
$109-119$
|
|
$124$
|
$119$
|
$129$
|
$119-129$
|
|
$134$
|
$129$
|
$139$
|
$129-139$
|
|
$144$
|
$139$
|
$149$
|
$139-149$
|
|
$154$
|
$149$
|
$159$
|
$149-159$
|
|
$164$
|
$159$
|
$169$
|
$159-169$
|
View full question & answer→Question 124 Marks
The water bills (in rupees) of $32$ houses in a certain street for the period $1.198$ to $31.398$ are given below: $56, 43, 32, 38, 56, 24, 68, 85, 52, 47, 35, 58, 63, 74, 27, 84, 69, 35, 44, 75, 55, 30, 54, 65, 45, 67, 95, 72, 43, 65, 35, 69.$ Tabulate the data and present the data as a cumulative frequency table using $70 - 79$ as one of the class intervals.
AnswerThe minimum bill is $Rs. 24$ The maximum bill is $Rs. 95$
Range = Maximum bill - Minimum bill
$= 95 - 24 = 71$
Given, class interval is $70 - 79.$
So, Class size $= 79 - 70 = 9$
Therefore number of classes $=\frac{\text{Range}}{\text{Class size}} = \frac{71}{9} = 7.80$
Number of classes $= 8$ The cumulative frequency distribution is as follows:
|
Bills
|
No. of Houses (Frequency)
|
Cumulative Frequency
|
|
$16-25$
|
$1$
|
$1$
|
|
$25-34$
|
$3$
|
$4$
|
|
$34-43$
|
$5$
|
$9$
|
|
$43-52$
|
$4$
|
$13$
|
|
$52-61$
|
$7$
|
$20$
|
|
$61-70$
|
$6$
|
$26$
|
|
$70-79$
|
$3$
|
$29$
|
|
$79-88$
|
$2$
|
$31$
|
|
$88-97$
|
$1$
|
$32$
|
View full question & answer→Question 134 Marks
Marks scored by $40$ students of class $IX$ in mathematics are given below: $81, 55, 68, 79, 85, 43, 29, 68, 54, 73, 47, 35, 72, 64, 95, 44, 50, 77, 64, 35, 79, 52, 45, 54, 70, 83, 62, 64, 72, 92, 84, 76, 63, 43, 54, 38, 73, 68, 52, 54$. Prepare a frequency distribution with class size of $10$ marks.
Answer
|
Marks
|
Tally Marks
|
Frequency
|
|
$20-30$
|
$|$
|
$1$
|
|
$30-40$
|
$|||$
|
$3$
|
|
$40-50$
|
$||||$
|
$5$
|
|
$50-60$
|
$||||\ |||$
|
$8$
|
|
$60-70$
|
$||||\ |||$
|
$8$
|
|
$70-80$
|
$||||\ ||||$
|
$9$
|
|
$80-90$
|
$||||$
|
$4$
|
|
|
|
Total $= 40$
|
View full question & answer→Question 144 Marks
Following data gives the number of children in $40$ families: $1, 2, 6, 5, 1, 5, 1, 3, 2, 6, 2, 3, 4, 2, 0, 0, 4, 4, 3, 2, 2, 0, 0, 1, 2, 2, 4, 3, 2, 1, 0, 5, 1, 2, 4, 3, 4, 1, 6, 2, 2.$ Represent it in the form of a frequency distribution.
Answer
|
Number of Children
|
Tally Marks
|
Number of Families
|
|
$0$
|
$||||$
|
$5$
|
|
$1$
|
$||||\ ||$
|
$7$
|
|
$2$
|
$||||\ ||||\ ||$
|
$12$
|
|
$3$
|
$||||$
|
$5$
|
|
$4$
|
$||||\ |$
|
$6$
|
|
$5$
|
$|||$
|
$3$
|
|
$6$
|
$|||$
|
$3$
|
View full question & answer→Question 154 Marks
Following are the ages of $360$ patients getting medical treatment in a hospital on a day.
|
Age (in years)
|
$10-20$
|
$20-30$
|
$30-40$
|
$40-50$
|
$50-60$
|
$60-70$
|
|
No of Patients
|
$90$
|
$50$
|
$60$
|
$80$
|
$50$
|
$30$
|
Construct a cumulative frequency table. Answer
|
Age (in years)
|
No. of students
|
Marks
|
Cumulative Frequency
|
|
$10-20$
|
$90$
|
Less than $20$
|
$90$
|
|
$20-30$
|
$50$
|
Less than $30$
|
$140$
|
|
$30-40$
|
$60$
|
Less than $40$
|
$200$
|
|
$40-50$
|
$80$
|
Less than $50$
|
$280$
|
|
$50-60$
|
$50$
|
Less than $60$
|
$330$
|
|
$60-70$
|
$30$
|
Less than $70$
|
$360$
|
|
|
N $= 360$
|
|
|
View full question & answer→Question 164 Marks
Construct a frequency table with equal class intervals from the following data on the monthly wages (in rupees) of 28 laborers working in a factory, taking one of the class intervals as $210-230 (230$ not included$)$.$ 220, 268, 258, 242, 210, 268, 272, 242, 311, 290, 300, 320, 319, 304, 302, 218, 306, 292, 254, 278, 210, 240, 280, 316, 306, 215, 256, 236$.
Answer
|
Monthly Wages (in rupees)
|
Tally marks
|
Frequency
|
|
$210-230$
|
$||||$
|
$4$
|
|
$230-250$
|
$||||$
|
$4$
|
|
$250-270$
|
$||||$
|
$5$
|
|
$270-290$
|
$|||$
|
$3$
|
|
$290-310$
|
$||||\ ||$
|
$7$
|
|
$310.0-330.0$
|
$||||$
|
$5$
|
|
|
|
Total $= 28$
|
View full question & answer→Question 174 Marks
The class size of distribution is $25$ and the first class-interval is $200-224$. There are seven class-intervals. Write the class-intervals.
AnswerGiven Class size $= 25$ First class interval $= 200-224$ Seven class interval are: $200-240, 225-249, 250-274, 275-299, 300-324, 325-349, 350-374$.
View full question & answer→Question 184 Marks
The marks scored by $55$ students in a test are given below:
|
Marks
|
$0-5$
|
$5-10$
|
$10-15$
|
$15-20$
|
$20-25$
|
$25-30$
|
$30-35$
|
|
No. of students
|
$2$
|
$6$
|
$13$
|
$17$
|
$11$
|
$4$
|
$2$
|
Prepare a cumulative frequency table. Answer
|
Marks
|
No. of Students
|
Marks
|
Cumulative Frequency
|
|
$0-5$
|
$2$
|
Less than $5$
|
$2$
|
|
$5-10$
|
$6$
|
Less than $10$
|
$8$
|
|
$10-15$
|
$13$
|
Less than $15$
|
$21$
|
|
$15-20$
|
$17$
|
Less than $20$
|
$38$
|
|
$20-25$
|
$11$
|
Less than $25$
|
$49$
|
|
$25-30$
|
$4$
|
Less than $30$
|
$53$
|
|
$30-35$
|
$2$
|
Less than $35$
|
$55$
|
|
|
N = 55
|
|
|
View full question & answer→Question 194 Marks
Given below are the cumulative frequencies showing the weights of 685 students of a school. Prepare a frequency distribution table.
|
Weight (in kg)
|
No. of students
|
|
Below $30$
|
$0$
|
|
Below $30$
|
$24$
|
|
Below $35$
|
$78$
|
|
Below $40$
|
$183$
|
|
Below $45$
|
$294$
|
|
Below $50$
|
$408$
|
|
Below $55$
|
$543$
|
|
Below $60$
|
$621$
|
|
Below $65$
|
$674$
|
|
Below $70$
|
$685$
|
Answer
|
Weight (in kg)
|
No. of students
|
Class interval
|
frequency
|
|
Below 30
|
24
|
25-30
|
24 - 0 = 24
|
|
Below 35
|
78
|
30-35
|
78 - 24 = 54
|
|
Below 40
|
183
|
35-40
|
183 - 78 = 105
|
|
Below 45
|
294
|
40-45
|
294 - 183 = 111
|
|
Below 50
|
408
|
45-50
|
408 - 294 = 114
|
|
Below 55
|
543
|
50-55
|
543 - 408 = 135
|
|
Below 60
|
621
|
55-60
|
621 - 543 = 78
|
|
Below 65
|
674
|
60-65
|
671 - 621 = 53
|
|
Below 70
|
685
|
65-70
|
685 - 671 = 11
|
View full question & answer→Question 204 Marks
The daily maximum temperatures (in degree Celsius) recorded in a certain city during the month of November are as follows: $25.8, 24.5, 25.6, 20.7, 21.8, 20.5, 20.6, 20.9, 22.3, 22.7, 23.1, 22.8, 22.9, 21.7, 21.3, 20.5, 20.9, 23.1, 22.4, 21.5, 22.7, 22.8, 22.0, 23.9, 24.7, 22.8, 23.8, 24.6, 23.9, 21.1$. Represent the data in the form of a frequency distribution table with class size $11^\circ\ C$.
Answer
|
Maximum Temperature(in degree Celsius)
|
Tally Marks
|
Frequency
|
|
$20.0-21.0$
|
$||||\ |$
|
$6$
|
|
$21.0-22.0$
|
$||||$
|
$5$
|
|
$22.0-23.0$
|
$||||\ ||||$
|
$9$
|
|
$23.0-24.0$
|
$||||$
|
$5$
|
|
$24.0-25.0$
|
$|||$
|
$3$
|
|
$25.0-26.0$
|
$||$
|
$2$
|
|
|
|
Total $= 30$
|
View full question & answer→Question 214 Marks
The class size of distribution is $25$ and the first class-interval is $200-224$. There are seven class-intervals. Write the class-marks of each interval.
AnswerGivenClass size $= 25$
Class mark $= 200-224$
$=\frac{200+224}{2}$
$=\frac{424}{2}$
$= 212$
Class mark $= 225-249$
$=\frac{225+249}{2}$
$=\frac{479}{2}$
$= 237$
Class mark $= 250-274$
$=\frac{250+274}{2}$
$=\frac{524}{2}$
$= 287$
Class mark $= 300-324$
$=\frac{300+324}{2}$
$=\frac{624}{2}$
$= 312$
Class mark $= 325-349$
$=\frac{325+349}{2}$
$=\frac{674}{2}$
$= 337$
Class mark $= 350-374$
$=\frac{350+374}{2}$
$=\frac{724}{2}$
$= 362$
View full question & answer→Question 224 Marks
The blood groups of $30$ students of class $VIII$ are recorded as follows:
$A, B, O, O, AB, O, A, O, B, A, O, B, A, O, O, A, AB, O, A, A, O, O, AB, B, A, O, B, A, B, O$
Represent this data in the form of a frequency distribution table. Find out which is the most common and which is the most rarest blood group among these students.
AnswerHere $9$ students have blood group $A, 6\ as\ B, 3\ as\ AB$ and $12\ as\ O$
So the table representing the data is as follows:
|
Blood Group
|
Number of Students
|
|
$A$
|
$9$
|
|
$B$
|
$6$
|
|
$AB$
|
$3$
|
|
$O$
|
$12$
|
|
Total
|
$30$
|
As $12$ students have their blood group $O$ and $3$ students have their blood group as AB. Therefore the most common blood group is $O$ and the rarest blood group is $AB$. View full question & answer→Question 234 Marks
AnswerThe data obtained in original form are called raw data. Raw data does not give any useful information and is rather confusing to mind. Data is grouped so that it becomes understandable and can be interpreted. According to various characteristics groups are formed by us. After grouping the data, we are in position to make calculations of certain values which will help us in describing and analyzing the data.
View full question & answer→Question 244 Marks
Three coins were tossed $30$ times. Each time the number of heads occurring was noted down as follows:
$0, 1, 2, 2, 1, 2, 3, 1, 3, 0, 1, 3, 1, 1, 2, 2, 0, 1, 2, 1, 3, 0, 1, 1, 2, 3, 2, 2, 0$
Prepare a frequency distribution table for the data given above. AnswerBy observing the data given above, the following frequency table can be constructed:
|
Number of Heads
|
Frequency
|
|
$0$
|
$6$
|
|
$1$
|
$10$
|
|
$2$
|
$9$
|
|
$3$
|
$5$
|
|
Total
|
$30$
|
View full question & answer→Question 254 Marks
The following cumulative frequency distribution table shows the daily electricity consumption $($in $KW)$ of $40$ factories in an industrial state.
| Consumption $($in $KW)$ |
No. of factories |
| Below $240$ |
$1$ |
| Below $270$ |
$4$ |
| Below $300$ |
$8$ |
| Below $330$ |
$24$ |
| Below $360$ |
$33$ |
| Below $390$ |
$38$ |
| Below $420$ |
$40$ |
$i.$ Represent this as a frequency distribution table.
$ii.$ Prepare a cumulative frequency table. Answer$i.$
| Consumption$($in $KW)$ |
No. of factories |
Class interval |
Frequency |
| Below $240$ |
$1$ |
$0-240$ |
$1$ |
| Below $270$ |
$4$ |
$240-270$ |
$4 - 1 = 3$ |
| Below $300$ |
$8$ |
$270-300$ |
$8 - 4 = 4$ |
| Below $330$ |
$24$ |
$300-330$ |
$24 - 8 = 16$ |
| Below $360$ |
$33$ |
$330-360$ |
$33 - 24 = 9$ |
| Below $390$ |
$38$ |
$360-390$ |
$38 - 33 = 5$ |
| Below $420$ |
$40$ |
$390-420$ |
$40 - 38 = 2$ |
$ii.$
| Class interval |
Frequency |
Consumption$($in $KW)$ |
No. of factories |
| $0-240$ |
$1$ |
More than $0$ |
$40$ |
| $240-270$ |
$3$ |
More than $240$ |
$40 - 1 = 39$ |
| $270-300$ |
$4$ |
More than $270$ |
$39 - 3 = 36$ |
| $300-330$ |
$16$ |
More than $300$ |
$36 - 4 = 32$ |
| $330-360$ |
$9$ |
More than $330$ |
$32 - 16 = 16$ |
| $360-390$ |
$5$ |
More than $360$ |
$16 - 9 = 7$ |
| $390-420$ |
$2$ |
More than $390$ |
$7 - 5 = 2$ |
| |
|
More than $420$ |
$2 - 2 = 0$ |
| |
$N = 40$ |
|
|
View full question & answer→Question 264 Marks
Write the class size and class limits in the following: $47, 52, 57, 62, 67, 72, 78, 82, 87, 92, 97, 102$.
Answer$47, 52, 57, 62, 67, 72, 78, 82, 87, 92, 97, 102$. Class size $= 52 - 47 = 5$
|
Class mark
|
Lower class limit
|
Upper class limit
|
Class limit
|
|
$47$
|
$44.5$
|
$49.5$
|
$44.5-49.5$
|
|
$52$
|
$49.5$
|
$54.5$
|
$49.5-54.5$
|
|
$57$
|
$54.5$
|
$59.5$
|
$54.5-59.5$
|
|
$62$
|
$59.5$
|
$64.5$
|
$59.5-64.5$
|
|
$67$
|
$64.5$
|
$69.5$
|
$64.5-69.5$
|
|
$72$
|
$69.5$
|
$74.5$
|
$69.5-74.5$
|
|
$77$
|
$74.5$
|
$79.5$
|
$74.5-79.5$
|
|
$82$
|
$79.5$
|
$84.5$
|
$79.5-84.5$
|
|
$87$
|
$84.5$
|
$89.5$
|
$84.5-89.5$
|
|
$92$
|
$89.5$
|
$94.5$
|
$89.5-94.5$
|
|
$97$
|
$94.5$
|
$99.5$
|
$94.5-99.5$
|
|
$102$
|
$99.5$
|
$104.5$
|
$99.5-104.5$
|
View full question & answer→