Question 11 Mark
Read the following bar graph and answer the following questions:
$i.$ What is the information given by the bar graph?
$ii.$ State the following whether true or false.
The number of goverment companies in $1957$ is that of $1982$ is $1 : 9$
$i.$ What is the information given by the bar graph?
$ii.$ State the following whether true or false.
The number of goverment companies in $1957$ is that of $1982$ is $1 : 9$
Answer
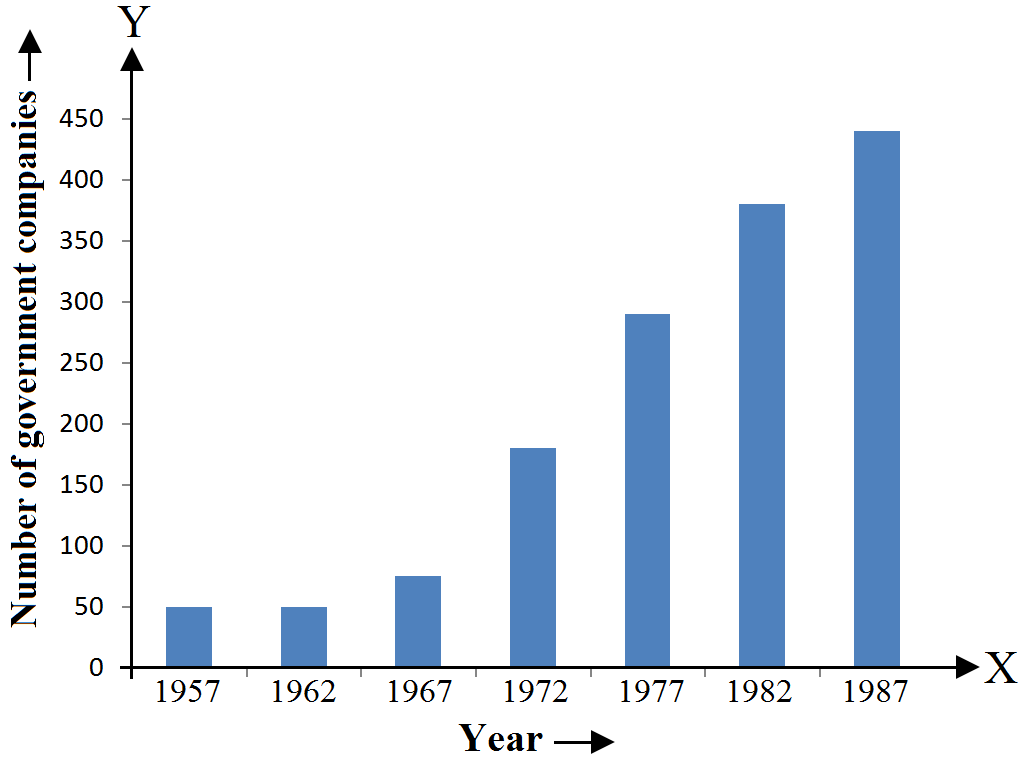
View full question & answer→$i.$ The bar graph represents the number of government companies in India from $1957$ to $1987.$
$ii.$ False.
Number of government companies in $1957 = 50$
Number of government companies in $1982 = 375$
The ratio of the number of government companies in $1957$ to that in $1982 =\frac{50}{375}=\frac{2}{15}=2:15$
$ii.$ False.
Number of government companies in $1957 = 50$
Number of government companies in $1982 = 375$
The ratio of the number of government companies in $1957$ to that in $1982 =\frac{50}{375}=\frac{2}{15}=2:15$