MCQ 11 Mark
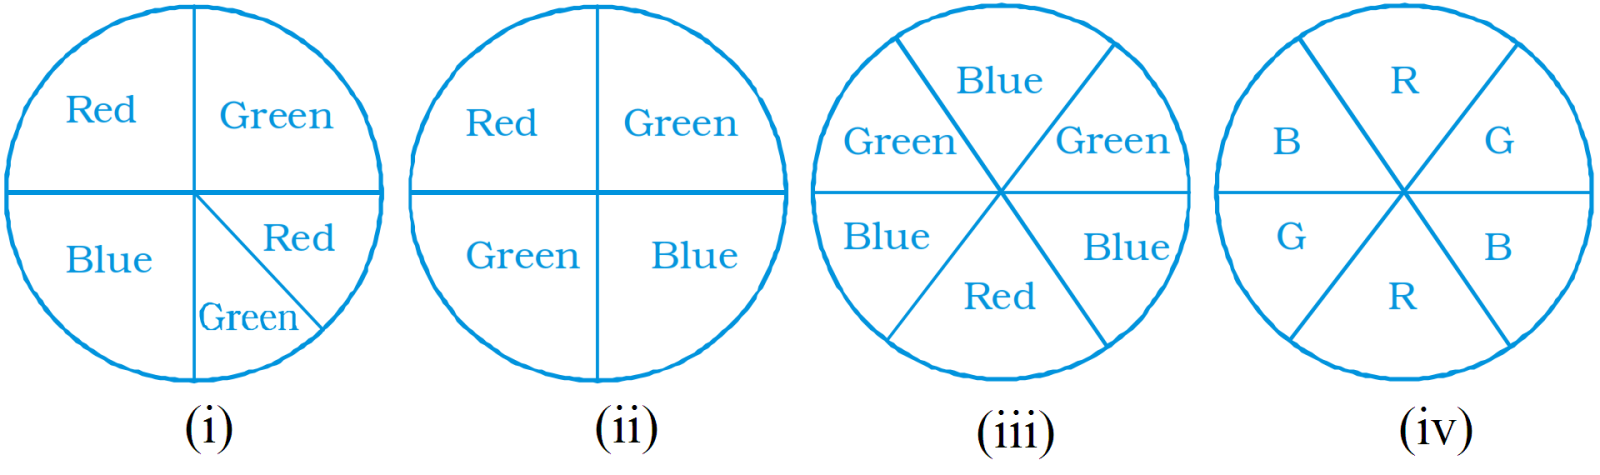
When a dice is thrown, outcomes $1, 2, 3, 4, 5, 6$ are___________.
- ✓Equally likely.
- BMutually exclusive.
- CRandom outcomes.
- DNone of these.
Answer
View full question & answer→Correct option: A.
Equally likely.
When a dice is thrown, outcomes $1, 2, 3, 4, 5, 6$ are equally likely.