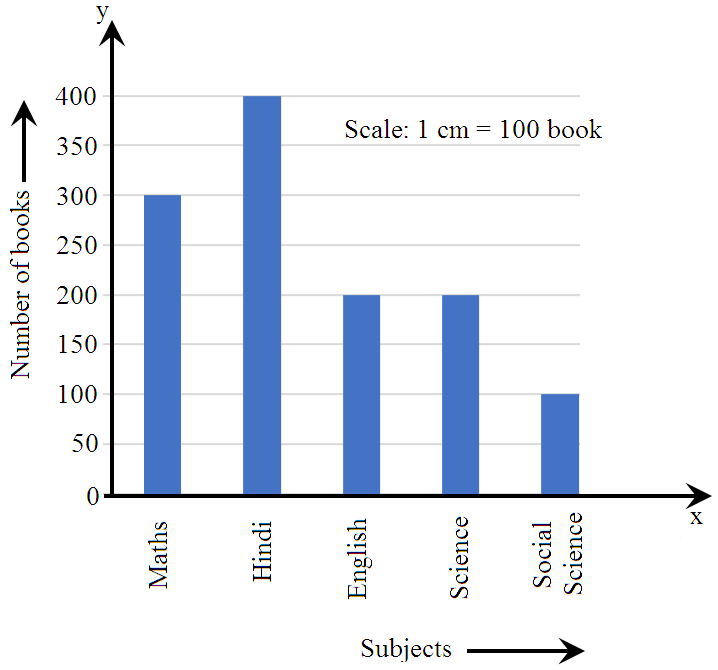
How many books are there of the subject whose books are minimum?
- A$100$
- B$200$
- ✓$300$
- D$400$
Social Science $\rightarrow 100.$

Social Science $\rightarrow 100.$
Arranging the data in the tally marks we get:

The most liked animal is cat which is liked by $6$ students.
A symbol is used to represent $10$ flowers
Number of symbols to be drawn to represent $60$ flowers $=\frac{60}{10}=6$
One card is drawn from a well-shuffled deck of $52$ card, possible out comes $= 52$ probability of a card being a black $6$
(Which are two) $=\frac{2}{52}=\frac{1}{26}$
Width of class interval = upper class limit-lower class limit$= 40 - 30$
$= 10$


Minimum frequency $= 2 \rightarrow 20-30$

|
Class interval Age (in years)
|
Number of Persons
|
|
$15-20$
|
$12$
|
|
$20-25$
|
$20$
|
|
$25-30$
|
$42$
|
|
$30-35$
|
$20$
|
|
$35-40$
|
$6$
|
Frequency of class $20-25 =$ Frequency of class $30-35 = 20$
Central angle of the sector representing the sikh community $=\Big(\frac{\text{value(in%)of each community}}{\text{100}}\times360\Big)^\circ$
$=\Big(\frac{35}{100}\times360\Big)^{\circ}$
$=126^\circ$
Even prime number$ = 2$
$\therefore$ Probability = $\frac{1}{6}$

The total number of people $= 2400$
So, number of people going to office by walking = $\frac{75}{360}\times2400 = 500$
|
Range of Marks Obtained
|
Number of students
|
|
$250–300$
|
$10$
|
|
$300–350$
|
$12$
|
|
$350–400$
|
$14$
|
|
$400–450$
|
$13$
|
|
$450–500$
|
$11$
|
When a die is thrown,
Number of total possible outcomes $= 6$
Number of even prime numbers $= 1 (2$ is the only even prime number)
Thus, the probability of getting a even prime number,
$\text{P} = \frac{1}{6}$

A die has six sides each consisting numbers from $1$ to $6$, i.e. $\{1, 2, 3, 4, 5, 6\}.$
Total possible outcomes $= 6$
Number of even numbers on a die $= 3$
i.e. $\{2, 4, 6\}$
Probability $=\frac{3}{6}=\frac{1}{2}$
|
Class interval Age (in years)
|
Number of Persons
|
|
$15-20$
|
$12$
|
|
$20-25$
|
$20$
|
|
$25-30$
|
$42$
|
|
$30-35$
|
$20$
|
|
$35-40$
|
$6$
|
Expenditure done on food $= 5 \times 1000$
$= Rs. 5000$
We know, histogram is a graphical representation of data using bars with no gap in between, i.e. it shows continuous data.
Also, the height of the bar shows the frequency of the class-interval.
Hence, option $B$ is correct.

$300 \rightarrow $ Maths.
The upper value of specific class interval is called the Upper limit of that class. And, the lower value of specific class interval is called the Lower limit of that class. Thus, the Upper Limit of Class Interval $35 – 45$ is $45.$
Class mark $= \frac{\text{Upper limit+ Lower limit}}{2}$
$\therefore $ Class mark of the class 20-30 $= \frac{30+ 20}{2}= \frac{50}{2}=25$
In a bag, there are $3$ white and $2$ red balls possible outcomes $= 3 + 2 = 5$
Now probability of a red ball drawn$=\frac{2}{5}$

Greatest percentage $= 40\% \rightarrow B$
Range of data = Maximum value - Minimum value $= 61 - 20 = 41$
|
Daily wages
|
Number of works
|
|
$290-325$
|
$5$
|
|
$325-360$
|
$2$
|
|
$360-395$
|
$4$
|
|
$395-430$
|
$6$
|
|
$430-465$
|
$7$
|
|
$465-500$
|
$5$
|
Required number $= 5 + 2 = 7$
|
Class Interval
|
Frequency
|
|
$0 - 10$
|
$1$
|
|
$10 - 20$
|
$6$
|
|
$20 - 30$
|
$20$
|
|
$30 - 40$
|
$12$
|
|
$40 - 50$
|
$6$
|
|
Total
|
$45$
|
|
Class interval Age (in years)
|
Number of Persons
|
|
$15-20$
|
$12$
|
|
$20-25$
|
$20$
|
|
$25-30$
|
$42$
|
|
$30-35$
|
$20$
|
|
$35-40$
|
$6$
|

Let the required percentage be $x$. Then we have:
$\Big(\frac{\text{x}}{100}\times360\Big)=81$
$\Rightarrow\frac{\text{360x}}{100}\times81$
$\Rightarrow\text{x}=\Big(81\times\frac{\text{100}}{360}\Big)$
$\Rightarrow\text{x}=\frac{45}{2}$
$\Rightarrow\text{x}=22\frac{1}{2}$
Hence, the percentage of students who are interested in reading novels is $22\frac{1}{2}\%$.
Tossing a coin, rolling a die and choosing a card from a deck of $52$ cards are the random experiments, as we don’t have an idea about the output of these experiments. But if we throw a stone from the roof of a building, we know the output, it will fail on the ground.