Question 12 Marks
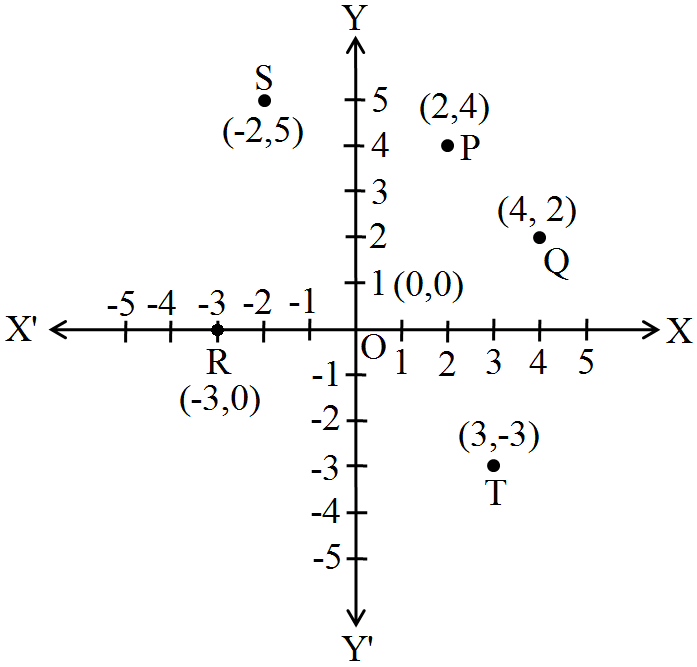
Plot the points (x, y) given by the following table:
|
x
|
2
|
4
|
-3
|
-2
|
3
|
0
|
|
y
|
4
|
2
|
0
|
5
|
-3
|
0
|
Answer
View full question & answer→On plotting the given points on the graph, we get the points P(2, 4), Q(4, 2), R(-3, 0), S(-2, 5), T(3, -3)and O(0, 0).