Question 15 Marks
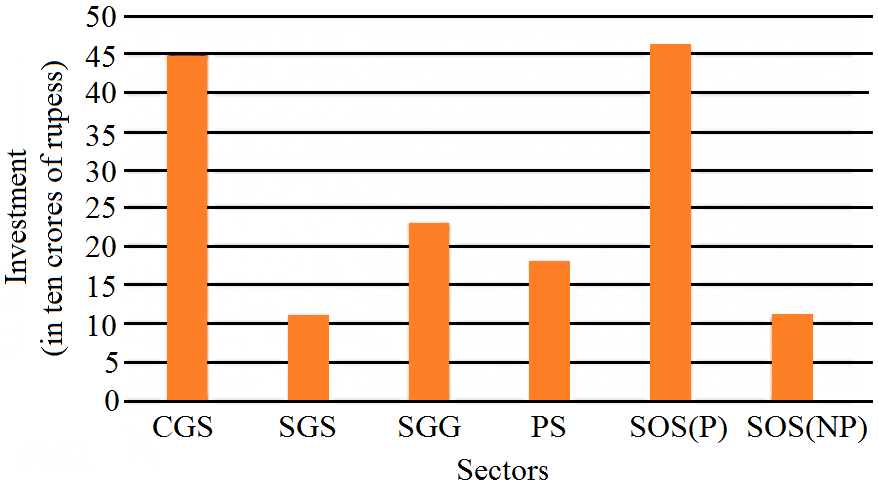
The investments (in ten crores of rupees) of Life Insurance Corporation of India in different sectors is given below:
Represent the above data with the help of a bar graph.
|
Sectors
|
Investment (in ten crores of rupess)
|
|
Central government securities
|
45
|
|
State government securities
|
11
|
|
Securities guaranteed by the government
|
23
|
|
Private sectors
|
18
|
|
Socially oriented sectors (plan)
|
46
|
|
Socially oriented sectors (Non–plan)
|
11
|
Answer
View full question & answer→To represent the given data by a vertical bar graph, we first draw horizontal and vertical axes. Let us consider that the horizontal and vertical axes represent the sectors and the investment in ten Crores of rupees respectively. We have to draw 6 bars of different lengths given in the table. At first, we mark 6 points in the horizontal axis at equal distances and erect rectangles of the same width at these points. The heights of the rectangles are proportional to the investments of Life Insurance Corporation of India. The vertical bar graph of the given data is following:
 The short forms used in the graph are:
The short forms used in the graph are:
- C.G.S.: Central Government Securities.
- S.G.S.: State Government Securities.
- S.G.G.: Securities Guaranteed by Government.
- R.S.: Private Sectors.
- S.O.S.(P): Socially Oriented Sectors (Plan).
- S.O.S.(NP): Socially Oriented Sectors (Non-Plan).
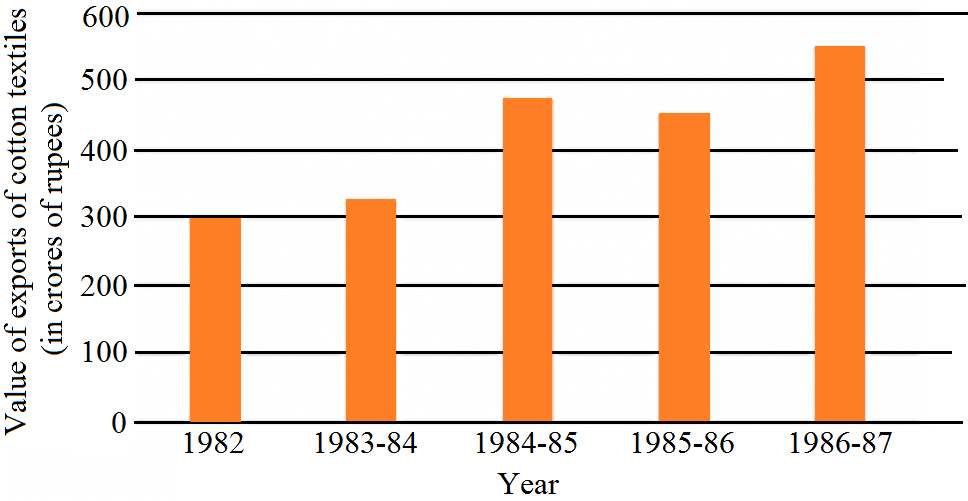 The export increases in the years 1983–84, 1984–85 and 1986–87. Now,
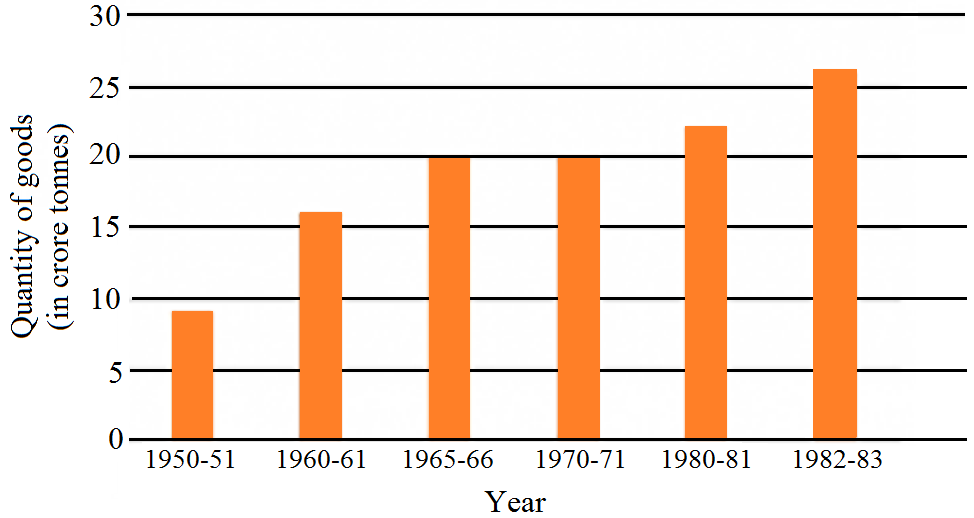 It is seen from the bar graph that the quantity of goods carried in the years 1950–51 and 1965–66 are 20 Crores tonnes and 9 Crores tonnes. Clearly 20 is more than 2 multiplied by 9. Hence, the statement is true.
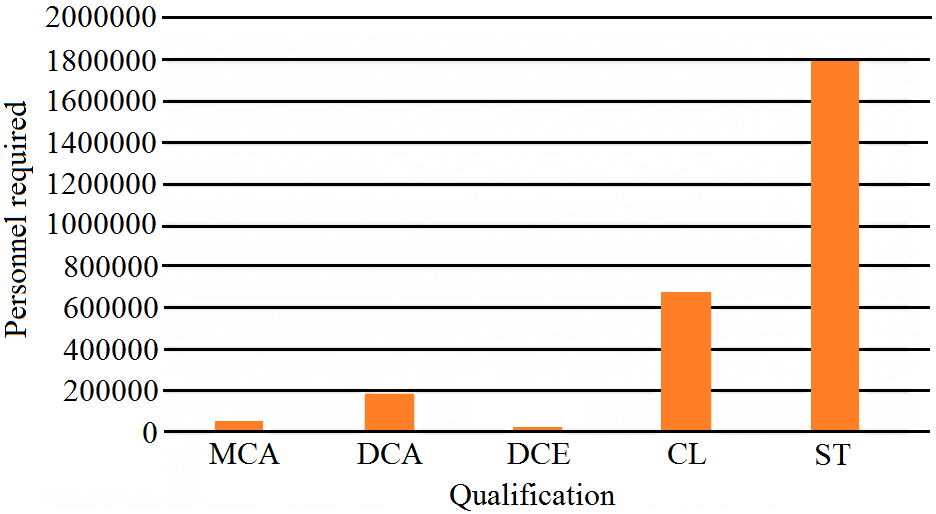 It is seen from the bar graph that the height of the 3ffl bar from the left is least, which is corresponding to DCE. Hence, the requirement is least in DCE.