Questions

5 Marks Questions

🎯

Test yourself on this topic

9 questions · timed · auto-graded

Question 15 Marks
Draw the graph of the equation, 2x + y = 6.
Find the coordinates of the point where the graph cuts the x-axis.
Answer
2x + y = 6 ⇒ y = 6 - 2x When, x = 0, y = 6 - 0 = 6 When. x = 1, y = 6 - 2 = 4 When, x = 2, y = 6 - 4 = 2.
x
0
1
2
Y
6
4
2
plot the point (0, 6), (1, 4) and (2, 2) on the graph paper. Join these points and extend the line.
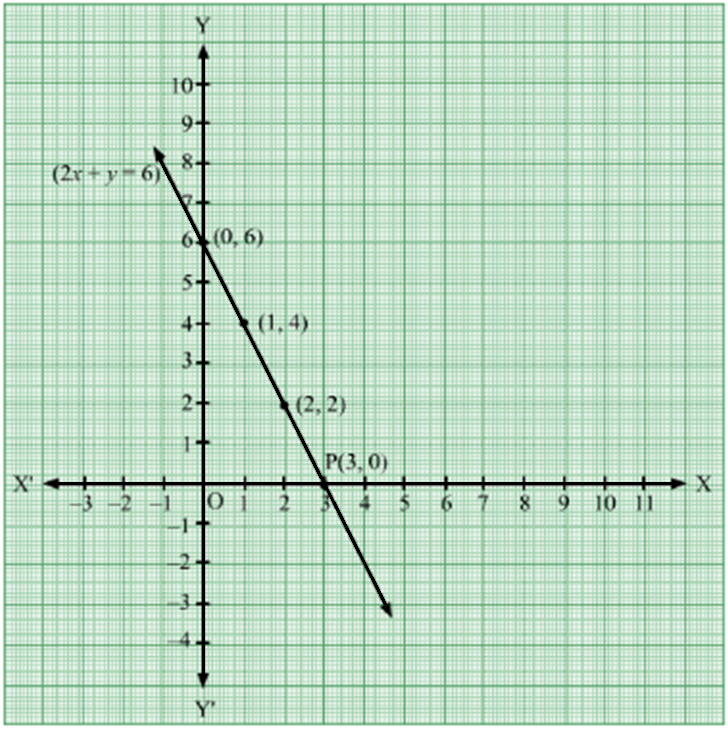
View full question & answer
Question 25 Marks
Draw the graph for each of the equations x + y = 6 and x - y = 2 on the same graph paper and find the coordinates of the point where the two straight lines intersect.
Answer
x + y = 6 ⇒ y = -x + 6 When x = 0, y = -0 + 6 = 6 When, x = 1, y = -1 + 6 = 5 When, x = 3, y = -3 + 6 = 3 Thus, the points on the line x + y = 6 are as given in the following table:
x
0
1
3
y
6
5
3
Plotting the points (0, 6), (1, 5) and (3, 3) and drawing a line passing through these points. we obtain the graph of the line x + y = 6. x - y = 2 ⇒ y = x - 2 When x = 0, y = 0 - 2 = -2 When x = 2, y = 2 - 2 = 0 When x = -1, y = -1 - 2 = -3 Thus, the points on the line x + y = 6 are as given in the following table
x
0
2
-1
y
-2
0
-3
Plotting the points (0, -2), (2, 0) and (-1, -3) and drawing a line passing through these points, we obtain the graph of the line x - y = 2.
It can be seen that the lines x + y = 6 and x - y = 2 intersect at the point (4, 2).
View full question & answer
Question 35 Marks
Draw the graphs of the lines x - y = 1 and 2x + y = 8. Shade the area formed by these two and the y-axis. Also, find this area.
Answer
x - y = 1⇒ y = x - 1
When x = 0, y = 0 - 1 = -1
When, x = 1, y = 1 - 1 = 0
When x = 2, y = 2 - 1 = 1
Thus, the points on the line x - y = 1 are as given in the following table:
x
0
1
2
y
-1
0
1
Plotting the points (0, 1), (1, 0) and (2, 1) and drawing a line passing through these points, we obtain the graph of the line x - y = 1.
2x + y = 8
⇒ y = -2x + 8
When, x = 1, y = -2 × 1 + 8 = -2 + 8 = 6
When, x = 2, y = -2 × 2 + 8 = -4 + 8 = 4
When, x = 3, y = -2 × 3 + 8 = -6 + 8 = 2
Thus, the points on the line 2x + y = 8 are as given in the following tabel:
x
1
2
3
y
6
4
2
Plotting the points (1, 6), (2, 4) and (3, 2) and drawing a line passing through these points, we obtain the graph of the line 2x + y = 8.

The shaded region represents the area bounded by the lines x - y = 1, 2x + y = 8 and the y-axis. This represents a triangle.
It can be seen that the lines intersect at the point C(3, 2). Draw CD perpendicular from C on the y-axis.
Height = CD = 3 units
Base = AB = 9 units
$\therefore\ $Area of the shaded region = Area of $\triangle\text{ABC}=\frac{1}{2}\times\text{AB}\times\text{CD}=\frac{1}{2}\times9\times3=\frac{27}{2}$ square units.
View full question & answer
Question 45 Marks
Draw the graph of the line 4x + 3y = 24.
  1. Write the coordinates of the point where this line interects the x-axis and the y-axis.
  2. Use this graph to find the area of the triangle formed by the graph line and the coordinate axes.
Answer
$4\text{x}+3\text{y}=24$$\Rightarrow3\text{y}=-4\text{x}+24$
$\Rightarrow\text{y}=\frac{-4\text{x}+24}{3}$
When, $\text{x}=0,\ \text{y}=\frac{-4\times0+24}{3}=\frac{0+24}{3}=\frac{24}{3}=8$
When, $\text{x}=3,\ \text{y}=\frac{-4\times3+24}{3}=\frac{-12+24}{3}=\frac{12}{3}=4$
When, $\text{x}=6,\ \text{y}=\frac{-4\times6+24}{3}=\frac{-24+24}{3}=\frac{0}{3}=0$
Thus, the points on the line 4x + 3y = 24 are as given in the following table:
x
0
3
6
y
8
4
0
Plotting the points (0, 8), (3, 4) and (6, 0) and drawing a line passing through these points, we obtain the graph of line 4x + 3y = 24.
  1. It can be seen that the line 4x + 3y = 24 interesects the x-axis at (6, 0) and y-axis at (0, 8).
  2. The triangle formed by the line and the coordinate axes is a right triangle right angled at get origine.
$\therefore\ $Area of the triangle $=\frac{1}{2}\times6\times8=24$ square units.
View full question & answer
Question 55 Marks
Draw the graph of the equation, 3x - 2y = 4 and x + y - 3 = 0.
On the same graph paper find the coordinates of the point where the two graph lines intersect.
Answer
$3\text{x}-2\text{y}=4$$\Rightarrow2\text{y}=3\text{x}-4$
$\Rightarrow\text{y}=\frac{3\text{x}-4}{2}$
When, $\text{x}=0,\ \text{y}=\frac{3\times0-4}{2}=\frac{0-4}{2}=\frac{-4}{2}=-2$
When, $\text{x}=2,\ \text{y}=\frac{3\times2-4}{2}=\frac{6-4}{2}=\frac{2}{2}=1$
When, $\text{x}=-2,\ \text{y}=\frac{3\times(-2)-4}{2}=\frac{-6-4}{2}=\frac{-10}{2}=-5$
Thus, the points on the line 3x - 2y = 4 are as given in the following table:
x
0
2
-2
y
-2
1
-5
Plotting the points (2, -2), (-2, -5) and drawing a line passing through these points, we obtain the graph of the line 3x - 2y = 4.
x + y - 3 = 0
⇒ y = -x + 3
When, x = 0, y = -0 + 3 = 3
When, x = 1, y = -1 + 3 = 2
When, x = -1, y = -(-1) + 3 = 1 + 3 = 4
Thus, the points on the line x + y - 3 = 0 are as given in the following tabel
x
0
1
-1
y
3
2
4
Plotting the points (0, 3), (1, 2) and (-1, 4) and drawing a line passing through these points, we obtain the graph of the line x + y = 0.

It can be seen that the linces 3x - 2y = 4 and x + y - 3 = 0 interesect at the point (2, 1).
View full question & answer
Question 65 Marks
Draw the graph of the equation 2x - 3y - 3 = 5.From your graph, Find:
  1. The value of y when x = 4
  2. The value of x when y = 3.
Answer
Given equation:$2\text{x}-3\text{y}-3=5$
$\Rightarrow2\text{x}=3\text{y}+5$
$\Rightarrow\text{x}=\frac{3\text{y}+5}{2}$
When, $\text{y}=-1,$$\text{x}=\frac{-3+5}{2}$
$\Rightarrow\frac{2}{2}=1$
When, $\text{y}=-3$$\text{x}=\frac{-9+5}{2}$
$\Rightarrow\frac{-4}{2}=-2$
Thus, we have the following table:
x
1
-2
y
-1
-3
plot the points (-2, -3), (1, -1) on the graph paper and extend the line both directions.
  1. When, x = 4:
$4=\frac{3\text{y}+5}{2}$
$\Rightarrow8=3\text{y}+5$
$\Rightarrow3\text{y}=8-5=3$
$\Rightarrow3\text{y}=3$
$\Rightarrow\text{y}=1$ 
  1. When, y = 3:
 $\text{x}=\frac{3\text{y}+5}{2}$
$\Rightarrow\frac{14}{2}=7$
View full question & answer
Question 75 Marks
Draw the graph of the lines 2x + y = 6 and 2x - y + 2 = 0. Shade the region bounded by these lines and the x-axis. Find the area of the shaded region.
Answer
2x + y = 6 ⇒ y = -2x + 6 When, x = 0, y = -2 × 0 + 6 = 0 + 6 = 6 When, x = 1, y = -2 × 1 + 6 = -2 + 6 = 4 When, x = 2, y = -2 × 2 + 6 = -4 + 6 = 2 Thus, the point on the line 2x + y = 6 are as given in the following tabel:
x
0
1
2
y
6
4
2
Plotting the pints (0, 6), (1, 4) and (2, 2) and drawing a line passing through these points, we obtain the graph of the line 2x + y = 6. 2x - y + 2 = 0 ⇒ y = 2x + 2 When, x = 0, y = 2 × 0 + 2 = 0 + 2 = 2 When, x = 1, y = 2 × 1 + 2 = 2 + 2 = 4 When, x = -1, y = 2 × (-1) + 2 = -2 + 2 = 0 Thus, the points on the line 2x - y + 2 = 0 are as given in the following tabel:
x
0
1
-1
y
2
4
0
Plotting the points (0, 2), (1, 4) and (-1, 0) and drawing a line passing through these points, we obain the graph of the line 2x - y + 2 = 0. 
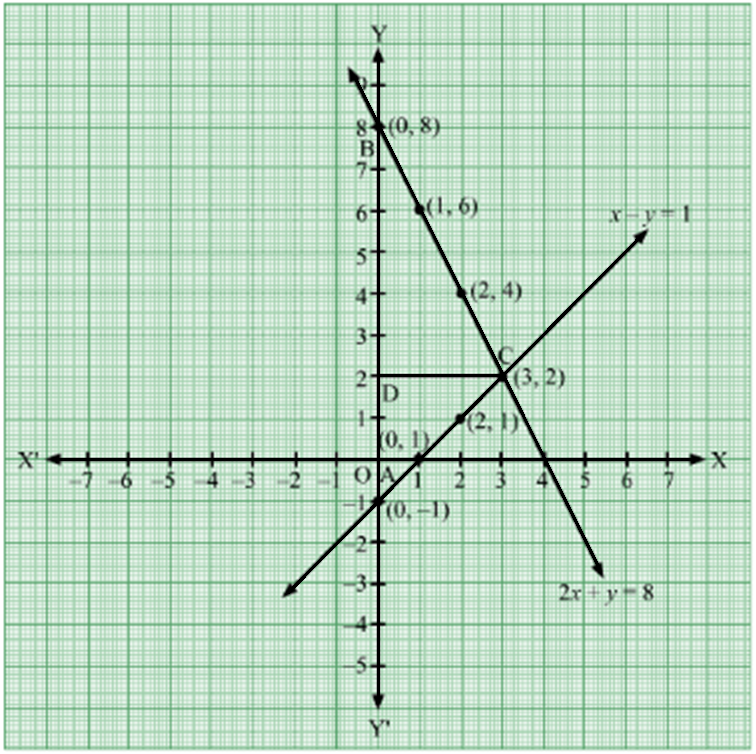
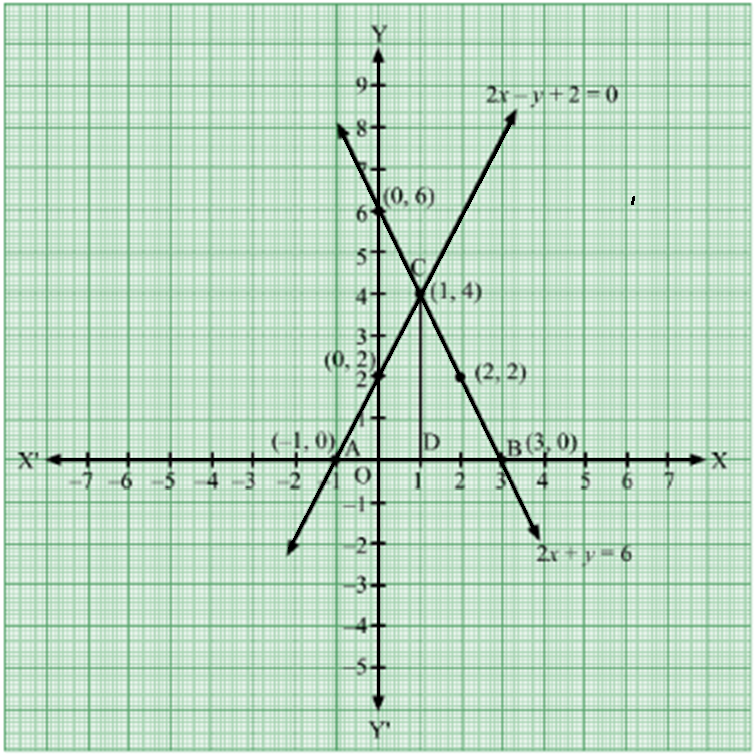
The shaded region represents the area bounded by the linces 2x + y = 6, 2x - y + 2 = 0 and the x-axis. This represents a triangle. It can be seen that the lines intersect at the point c(1, 4). Draw CD perpendicular from C on the x-axis. Height = CD = 4 units Base = AB = 4 units$\therefore\ $Area of the shaded region = Area of $\triangle\text{ABC}=\frac{1}{2}\times\text{AB}\times\text{CD}=\frac{1}{2}\times4\times4=8$ square units.
View full question & answer
Question 85 Marks
Two students A and B contributed Rs. 100 towards the prime Minister's Relief Fund to help the earthquake victims. Write a linear equation to satisfy the above data and draw its graph.
Answer
Let: The contribution of A and B be Rs. x and Rs. y, respectively. Total contribution of A and B = Rs. x + Rs. y = Rs. (x + y) It is given that the total contribution of A and B is Rs. 100.$\therefore\ $x + y = 100
This is the linear equation satisfying the given data. x + y = 100 ⇒ y = 100 - x When, x = 10, y = 100 - 10 = 90 When, x = 40, y = 100 - 40 = 60 When, x = 60, y = 100 - 60 = 40 Thus, the points on the line x + y = 100 are as given in the following tabel:
x
10
40
60
y
90
60
40
Plotting the points (10, 90), (40, 60) and (60, 40) and drawing a line passing through these points, we obains the graph of the line x + y = 100.
View full question & answer
Question 95 Marks
Draw the graph of the equation, 3x + 2y = 6.
Find the coordinates of the point where the graph cuts the y-axis.
Answer
Given equation:$3\text{x}+2\text{y}=6.$
Then,$2\text{y}=6-3\text{x}$
$\Rightarrow\text{y}=\frac{6-3\text{x}}{2}$
When, $\text{x}=2,\ \text{y}=\frac{6-6}{2}=0$ When, $\text{x}=4,\ \text{y}=\frac{6-12}{2}=-3$ Thus, we get the following table:
x
2
4
y
0
-3
plot the points (2, 0), (4, -3) on the graph paper. join the points and extend the graph in both the directions. 
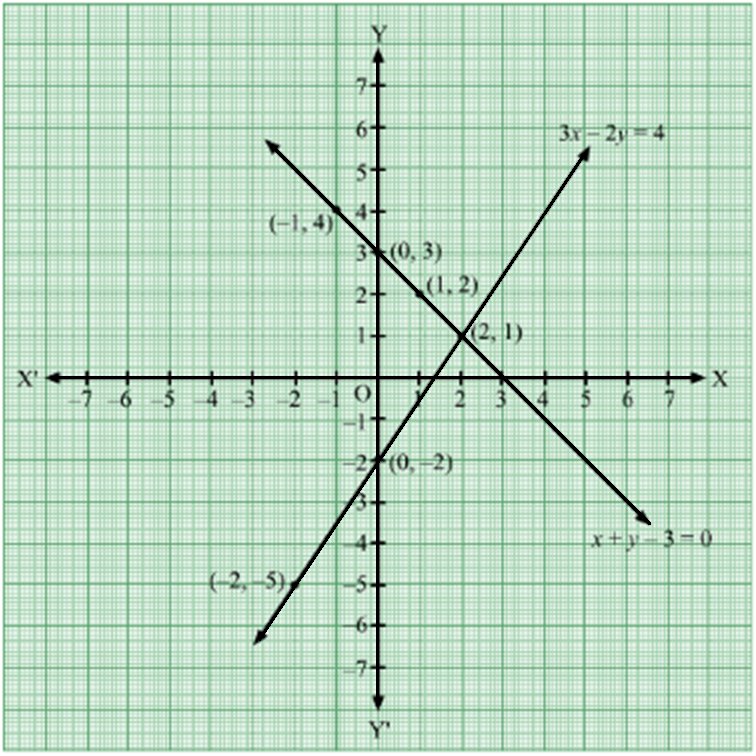
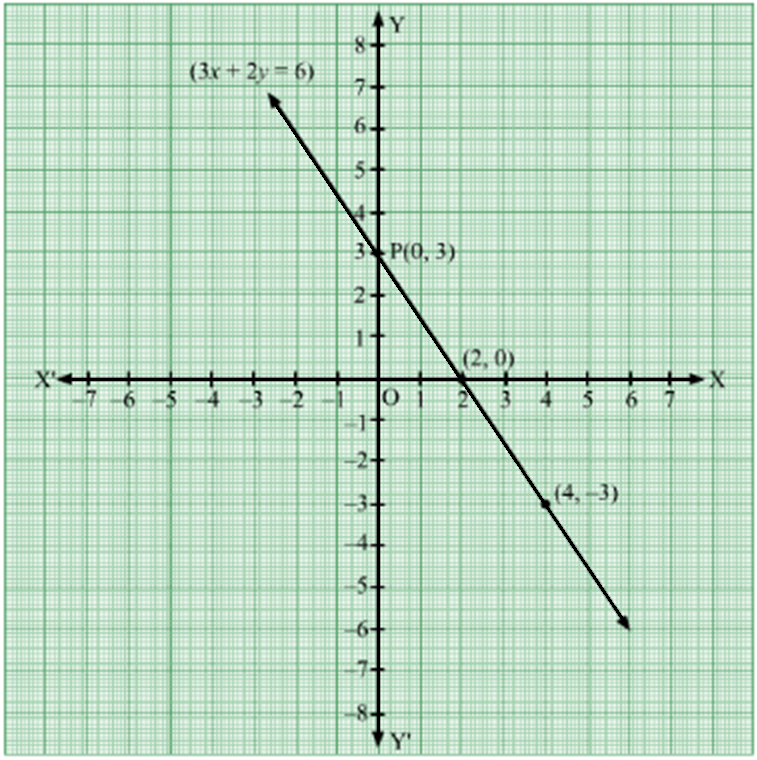
Clearly, the graph cuts the y-axis at p(0, 3).
View full question & answer
5 Marks Questions - MATHS STD 9 Questions - Vidyadip