MCQ 1011 Mark
The weight of $10$ students $($in kg$)$ are: $55, 40, 35, 52, 60, 38, 36, 45, 31, 44.$ The median weight is.
- A
$41kg$
- ✓
$42kg$
- C
$44kg$
- D
$40kg.$
AnswerCorrect option: B. $42kg$
Arranging the numbers in ascending order, we have:
$31, 35, 36, 38, 40, 44, 45, 52, 55, 60$
Here, $n$ is $10,$ which is an even number. Thus, we have:
Median $=$ Mean of $\Big(\frac{\text{n}}{2}\Big)\text{th}$ obervation & $\Big(\frac{\text{n}}{2}+1\Big)\text{th}$ obervation Median Weight $=$ mean of the weights of $\Big(\frac{10}{2}\Big)\text{th}$ student & $\Big(\frac{10}{2}+1\Big)\text{th}$ student $=$ mean of the weights of $5th$ student & $6th$ student$=\frac{1}{2}(40+44)=42$
Hence, the median weight is $42kg.$
View full question & answer→MCQ 1021 Mark
An ogive is used to determine:
AnswerAn ogive is used to determine how many data values lie above or below a particular value in a data set.
In other words, it is used to determine the Median of a grouped data.
View full question & answer→MCQ 1031 Mark
If $\bar{\text{x}}$ is the mean of $x_1, x_2, \ldots, x_n$ then for $\text{a}\neq0,$ the mean $ax, ax_2, ..., axn,\frac{\text{x}_1}{\text{a}},\frac{\text{x}_2}{\text{a}},\ \dots,\frac{\text{x}_\text{n}}{\text{a}}$ is:
- A
$\Big(\text{a}+\frac{1}{\text{a}}\Big)\bar{\text{x}}$
- ✓
$\Big(\text{a}+\frac{1}{\text{a}}\Big)\frac{\bar{\text{x}}}{2}$
- C
$\Big(\text{a}+\frac{1}{\text{a}}\Big)\frac{\bar{\text{x}}}{\text{n}}$
- D
$\frac{\Big(\text{a}+\frac{1}{\text{a}}\Big)\bar{\text{x}}}{2\text{n}}$
AnswerCorrect option: B. $\Big(\text{a}+\frac{1}{\text{a}}\Big)\frac{\bar{\text{x}}}{2}$
Required mean $=\frac{(\text{ax}_1+\text{ax}_2+_{\dots}+\text{ax}_\text{n})+(\frac{\text{x}_1}{\text{a}},\frac{\text{x}_2}{\text{a}},\ \dots,\frac{\text{x}_\text{n}}{\text{a}})}{2\text{n}}$
$=\frac{1}{2}\bigg[\frac{\text{a}(\text{x}_1+\text{x}_2+{\dots}+\text{x}_\text{n})}{\text{n}}+\frac{\frac{1}{2}(\text{x}_1+\text{x}_2+{\dots}+\text{x}_\text{n})}{\text{n}}\bigg]$
$=\frac{1}{2}\Big[\text{a}\bar{\text{x}}+\frac{1}{\text{a}}\bar{\text{x}}\Big]$
$=\Big[\text{a}+\frac{1}{\text{a}}\Big]\frac{\bar{\text{x}}}{2}$
View full question & answer→MCQ 1041 Mark
What is the upper limit of the interval: $20 - 23?$
AnswerMaximum value of an interval is called the upper limit.
View full question & answer→MCQ 1051 Mark
Given the class intervals $0-10, 10-20, 20-30,…$ then $10$ is considered in class:
- A
$0-10$
- ✓
$10-20$
- C
$0-20$
- D
$10-30$
AnswerCorrect option: B. $10-20$
As the classes are continuous, the upper limits do not include in that particular class.
View full question & answer→MCQ 1061 Mark
If the arithmetic mean of $7, 5, 13, x$ and $9$ is $10,$ then the value $x$ is:
Answer$\text{Mean}=\frac{7+5+13+\text{x}+9}{5}=10$
$\Rightarrow34+\text{x}=50$
$\Rightarrow\text{x}=16$
View full question & answer→MCQ 1071 Mark
The empirical relationship between the three measures of central tendencies is:
- A
$3$ mode $=$ mean $+\ 2$ median
- ✓
Mode $= 3$ median $-\ 2$ mean
- C
- D
$3$ mean $=$ median $+\ 2$ mode
AnswerCorrect option: B. Mode $= 3$ median $-\ 2$ mean
The empirical relationship between the three measures of central tendencies is $3$ Median $=$ Mode $+\ 2$ Mean.
The relationship is as per observation. A distribution in which the values of mean, median and mode coincide $($i.e., mean $=$ median $=$ mode$)$ is called symmetrical
Distribution. conversely, when the values of mean, median, mode are not equal, the distribution is called asymmetrical or skewed.
Knowing any two values, the third can be computed by this formula
$3$ median $= 2$ mean $+$ mode
$2$ mean $= 3$ median $–$ mode
$\text{Mean}=\frac{1}{2}(3 \text{ median - mode})$
View full question & answer→MCQ 1081 Mark
In an examination, ten students scored the following marks: $60, 58, 90, 51, 47, 81, 70, 95, 87, 99.$ The range of this data is.
AnswerDifference between the maximum and minimum value of the observation is called as range.
So, $99 - 47 = 52$
View full question & answer→MCQ 1091 Mark
If $x_1, x_2, x_3, \ldots . x n$ are the means of $n$ groups with $n_1, n_2, \ldots n_i$ number of observations respectively, then the mean $x$ of all the groups taken together is:
- A
$\displaystyle\sum_{\text{i=1}}^{\text{n}}\text{n}_\text{i}\text{x}_\text{i}$
- B
$\frac{\displaystyle\sum_{\text{i=1}}^{\text{n}}\text{n}_\text{i}\text{x}_\text{i}}{2\text{n}}$
- ✓
$\frac{\displaystyle\sum_{\text{i=1}}^{\text{n}}\text{n}_\text{i}\text{x}_\text{i}}{\displaystyle\sum_{\text{i=1}}^{\text{n}}\text{n}_\text{i}}$
- D
$\frac{\displaystyle\sum_{\text{i=1}}^{\text{n}}\text{n}_\text{i}\text{x}_\text{i}}{\text{n}^2}$
AnswerCorrect option: C. $\frac{\displaystyle\sum_{\text{i=1}}^{\text{n}}\text{n}_\text{i}\text{x}_\text{i}}{\displaystyle\sum_{\text{i=1}}^{\text{n}}\text{n}_\text{i}}$
The mean is equal to the sum of all the values in the data set divided by the number of values in the data set.
View full question & answer→MCQ 1101 Mark
The class size of a distribution is $25$ and the first class interval is $200-224.$ Then, the class marks of first two class intervals are:
- A
$212, 262$
- B
$237, 262$
- C
$237, 287$
- ✓
$212, 237$
AnswerCorrect option: D. $212, 237$
For $1st$ class mark
Class mark $=\frac{\text{(upper limit +lower limit)}}{2}$
$1st$ class mark $= 212$
Add the class size to get the class mark of the next class
$2nd$ class mark $= 212 + 25$
$2nd$ class mark $= 237$
Hence, the class mark of first two intervals are $212$ and $237.$
View full question & answer→MCQ 1111 Mark
Find the range of the following data: $25, 20 30, 18, 16, 15:$
AnswerThe difference between the maximum and minimum value is called range.
Thus, $30 - 15 = 15$
View full question & answer→MCQ 1121 Mark
Write the correct answer in the following: The median of the data $78, 56, 22, 34, 45, 54, 39, 68, 54, 84$ is:
AnswerArranging the data in ascending order, we get
$22, 34, 39, 45, 54, 56, 78, 84$
Here $n = 9$, which is an odd number.
$\therefore\ \text{Median}=\Big(\frac{\text{n}+1}{2}\Big)^{\text{th}}$
$\text{Value}=\Big(\frac{9+1}{2}\Big)^{\text{th}}$
$\text{value}=5^{\text{th}}\text{value}$
So, median $= 54$
View full question & answer→MCQ 1131 Mark
The runs scored by $11$ members of a cricket team are. $15, 34, 56, 27, 43, 29, 31, 13, 50, 20, 0$. The median score is:
AnswerArranging the weight of $10$ students in ascending order, we have:
$0, 13, 15, 20, 27, 29, 31, 34, 43, 50, 56$
Here, $n$ is $11$, which is an odd number. Thus, we have:
Median = Value of $\bigg(\frac{\text{n}+1}{2}\bigg)\text{th}$ observation median score
= Value of $\bigg(\frac{11+1}{2}\bigg)\text{th}$ term
= Value of $6\ th$ term
= $29$
View full question & answer→MCQ 1141 Mark
The range of the data: $25, 18, 20, 22, 16, 6, 17, 15, 12, 30, 32, 10, 19, 8, 11, 20$ is:
AnswerRange $= 32 - 6 = 26$
View full question & answer→MCQ 1151 Mark
The algebraic sum of the deviations of a set of n values from their mean is:
AnswerIf $\overline{\text{X}}$ be the mean of the n observations $q x_1, \ldots . x_n$ Then we have
$\overline{\text{X}}=\frac{1}{\text{n}}\sum\limits_{\text{i}=1}^{\text{n}}\text{X}_\text{i}$
$\Rightarrow\sum\limits_{\text{i}=1}^{\text{n}}\text{X}_\text{i}=\overline{\text{X}}$
Let $\overline{\text{X}}$ be the mean of n Values $x_i, \ldots . x_n$. so we have
$\overline{\text{X}}=\frac{1}{\text{n}}\sum\limits_{\text{i}=1}^{\text{n}}\text{X}_\text{i}$
$\Rightarrow\sum\limits_{\text{i}=1}^{\text{n}}\text{X}_\text{i}=\text{n}\overline{\text{X}}$
The sum of the deviations of n values $x_i, \ldots . x_n$ from their mean $\overline{\text{X}}$ is
$(\text{x}_1-\overline{\text{X}})+(\text{x}_2-\overline{\text{X}})+.....+(\text{x}_\text{n}-\overline{\text{X}})$
$=\sum\limits_{\text{i}=1}^{\text{n}}(\text{x}_\text{i}-\overline{\text{X}})$
$=\sum\limits_{\text{i}=1}^{\text{n}}\text{x}_\text{i}-\sum\limits_{\text{i}=1}^{\text{n}}\overline{\text{X}}$
$=\text{n}\overline{\text{X}}-\text{n}\overline{\text{X}}$
$=0$
View full question & answer→MCQ 1161 Mark
Find the median of the given data: $7, 8, 7, 7, 9, 10, 13$.
AnswerMedian is the value separating the higher half of the data sample from the lower half.
Arrange the given data in ascending order.
Value of the middle term is the median of the given data sample.
$7, 7, 7, 8, 9, 10, 13$
Since 8 is in the centre so $8$ is the median.
View full question & answer→MCQ 1171 Mark
The median of the following data : $0, 2, 2, 2, -3, 5, -1, 5, −3, 6, 6, 5, 6$ is:
AnswerData: $0, 2, 2, 2, -3, 5, -1, 5, 5, -3, 6, 6, 5, 6$
Rearranging data in increasing order, we have
$-3, -3, -1, 0, 2, 2, 5, 5, 5, 5, 6, 6, 6$
Number of observations $= n = 14$ (even)
Now,
$\text{Median}=\frac{\Big(\frac{\text{n}}{2}\Big)^{\text{th}}\text{observation}+\Big(\frac{\text{n}+1}{2}\Big)^{\text{th}}\text{observation}}{2}$
$=\frac{7^{\text{th}}\text{observation}+8^{\text{th}}\text{observation}}{2}$
$=\frac{2+5}{2}$
$\Rightarrow\text{Median}=3.5$
View full question & answer→MCQ 1181 Mark
The difference between the upper and the lower class limits is called:
AnswerThe difference between the upper class limit and the lower class limit is called class size.
View full question & answer→MCQ 1191 Mark
Which of the following variables are discrete?
$A.$ Size of shoes.
$B.$ Number of pages in a book.
$C.$ Distance travelled by a train.
$D.$ Time.
- A
$A$ and $D$
- ✓
$A$ and $B$
- C
$B$ and $D$
- D
$A$ and $C$
AnswerCorrect option: B. $A$ and $B$
Discrete variables are variables that can only take finite values.
Size of shoes and pages in the book have a finite number.
View full question & answer→MCQ 1201 Mark
The mean of first four prime numbers is:
AnswerCorrect option: D. $4.25$
The mean is equal to the sum of all the values in the data set divided by the number of values in the data set.
The first $4$ prime numbers are $2, 3, 5, 7$
So, mean is $\frac{17}{4}=4.25$
View full question & answer→MCQ 1211 Mark
A grouped frequency distribution table with classes of equal sizes using $105-120$ ($120$ not included) as one of the class intervals is constructed for the following data: The number of classes in the distribution will be:
|
$125$
|
$126$
|
$140$
|
$98$
|
$128$
|
$78$
|
$108$
|
$67$
|
|
$87$
|
$149$
|
$102$
|
$136$
|
$145$
|
$112$
|
$103$
|
$84$
|
|
$123$
|
$130$
|
$120$
|
$89$
|
$103$
|
$65$
|
$96$
|
$65$
|
AnswerMaximum value of the observation is $149$ & minimum value is $65$.
This range of data need to grouped into classes of equal sizes with $105-120$ as one class.
Thus we need to construct classes of width $15$.
Below $6$ classes can be constructed
$60-75, 75-90, 90-105, 105-120, 120-135, 135-150$
View full question & answer→MCQ 1221 Mark
Less than' cumulative frequency table for a given data is as follows. Then, the frequency of class interval $20-30$ is:
|
Marks
|
Less than $10$
|
Less than $20$
|
Less than $300$
|
Less than $40$
|
|
Cumulative frequency
|
$3$
|
$17$
|
$37$
|
$92$
|
AnswerA cumulative frequency distribution is the sum of the class and all classes below it in a frequency distribution.
Less than $30$ has the class interval 20-30. Frequency of this class interval will be corresponding to
|
Marks
|
Cumulative Frequency
|
Class
|
Frequency
|
|
Less than $10$
|
$3$
|
$1-10$
|
$3$
|
|
Less than $20$
|
$17$
|
$10-20$
|
$14$
|
|
Less than $30$
|
$37$
|
$20-30$
|
$20$
|
|
Less than $40$
|
$92$
|
$30-40$
|
$55$
|
$37 - 17 = 20$ View full question & answer→MCQ 1231 Mark
Tally are usually marked in a bunch of:
AnswerTally are usually marked in a bunch of $5 : 4$ in a vertical line and one is placed diagonally.
View full question & answer→MCQ 1241 Mark
One of the sides of a frequency polygon is:
- A
Neither of the coordinate axes.
- ✓
The $x$-axis.
- C
Either of the coordinate axes.
- D
The $y$-axis.
AnswerCorrect option: B. The $x$-axis.
In frequency polygon $x$-axis repesents data value whereas $y$-axis is used represent the frequencies of the data.
We include one class below lowest value and one class above highest value with zero frequencies.
The graph touches the $x$-axis at these points.
So, one sides of the frequency polygon is $x$-axis.
View full question & answer→MCQ 1251 Mark
If each observation of the data is increased by $5$, then their mean.
AnswerCorrect option: B. Is increased by $5$.
Is increased by $5$.
Then old mean $x$ old $=\frac{\displaystyle\sum_{\text{i}=1}^{\text{n}}\text{x}_{\text{i}}}{\text{n}}$
Now, adding $5$ in each observation, the new mean becomes
$\overline{\text{x}}_\text{New}=\frac{(\text{x}_1+5)+(\text{x}_2+5)+....+(\text{x}_\text{n}+5)}{\text{n}}$
$\Rightarrow\overline{\text{x}}_\text{New}=\frac{(\text{x}_1 + \text{x}_2+....+\text{x}_\text{n})+5\text{n})}{\text{n}}$
$\Rightarrow\overline{\text{x}}_\text{New}=\frac{\displaystyle\sum_{\text{i}=1}^{\text{n}}\text{x}_{\text{i}}}{\text{n}}+5=\overline{\text{x }}{\text{old}}+5$
$\Rightarrow\overline{\text{x}}_\text{New}=\overline{\text{x}}_\text{old}+5$
View full question & answer→MCQ 1261 Mark
The width of each of five continuous classes in a frequency distribution is $5$ and the lower-class limit of the lowest class is $10$. The upper-class limit of the highest class is:
AnswerThe classes are $10-15, 15-20, 20-25, 25-30, 30-35$ so that upper limit of the highest class is $35$.
View full question & answer→MCQ 1271 Mark
A data is such that its maximum value is $75$ and range is $20$, then the minimum value is:
AnswerDifference between the maximum and minimum value of the observations is called as range.
Let, minimum value be $'x'$
$75 - x = 20$
So, $x = 55$
View full question & answer→MCQ 1281 Mark
Write the correct answer in the following: The class marks of a frequency distribution are given as follows: $15, 20, 25, ....$ The class corresponding to the class mark $20$ is:
- A
$12.5 - 17.5$
- ✓
$17.5 - 22.5$
- C
$18.5 - 21.5$
- D
$19.5 - 20.5$
AnswerCorrect option: B. $17.5 - 22.5$
The class mark are $15, 20, 25, ….$
The size of each class interval is $25 - 20 = 20 - 15 = 5$
Hence, the class interval corresponding to the class mark $20$ is,
$(20 - 2.5) - (20 + 2.5)$ i.e., $17.5 - 22.5$.
So, $(b)$ is the correct answer.
View full question & answer→MCQ 1291 Mark
The graph given below shows the frequency distribution of the age of $22$ teachers in a school. The number of teachers whose age is less than $40$ years is:
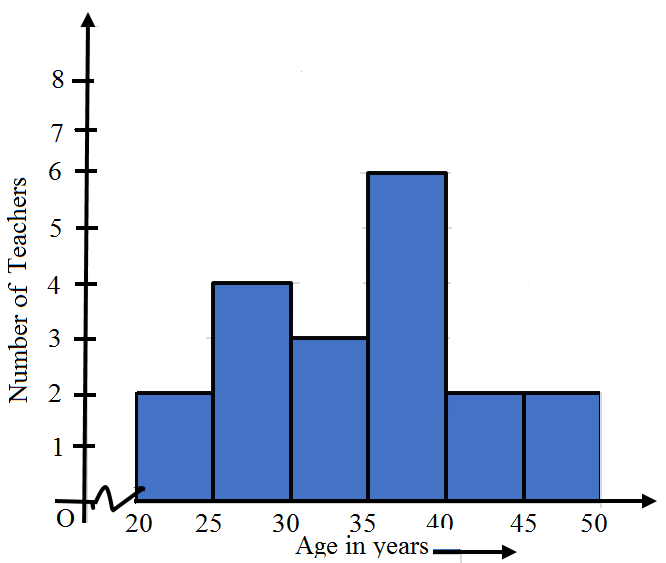
AnswerAdd the values corresponding to the height of the bar before $40$.
$6 + 3 + 4 + 2 = 15$.
View full question & answer→MCQ 1301 Mark
The mean of prime numbers between $30$ and $40$ is:
AnswerPrime numbers between $30$ and $40$ are $31$ and $37$.
Mean $=\frac{31+37}{2}$
Mean $=34$
View full question & answer→MCQ 1311 Mark
Find the median of the given data: $7, 8, 7, 7, 9, 10, 13$.
AnswerArrange the given data in ascending order.
$7, 7, 7, 8, 9, 10, 13$
For odd number $(n)$ of observation median $=\Big[\frac{(\text{n+1)}}{2}\Big]\text{th}$ term,
Here $n = 7$ so median $=\Big[\frac{{(7+1)}}{2}\Big]\text{th}$ term $= 4th$ term that is $8$,
Hence median $= 8$
View full question & answer→MCQ 1321 Mark
What is class size of interval $10, 12, 14, 16, 18$?
AnswerDifference between the successive values of the class is called the class size.
View full question & answer→MCQ 1331 Mark
- A
$3$(Mode – Mean)
- ✓
$3$(Mean – Median)
- C
$3$(Median – Mean)
- D
$3$(Mean – Mode)
AnswerCorrect option: B. $3$(Mean – Median)
Since, Mean – Mode + Mean + $2$ Mode = $3$ Median
$\Rightarrow $ Mean – Mode = $3$ Median – Mean – $2$ Mode
$= 3$ Median – Mean – $2 (3$ Median – $2$ Mean$)$
$= 3$ Median – Mean – $6$ Median + $4$ Mean
$= 3$ Mean – $3$ Median
$= 3$ (Mean – Median)
View full question & answer→MCQ 1341 Mark
To analyse the election results, the data is collected from a newspaper. The data thus collected is known as:
AnswerSecondary data is the readily available data collected by someone else & published in newspapers or journals etc.
View full question & answer→MCQ 1351 Mark
Median of the following numbers: $4, 4, 5, 7, 6, 7, 7, 12, 3$ is:
AnswerThe observations in ascending order can be written as:
$3, 4, 4, 5, 6, 7, 7, 7, 12$
Median $=\Big(\frac{9+1}{2}\Big)\text{th}$ term $= 5th$ term $= 6$
View full question & answer→MCQ 1361 Mark
The following marks were obtained by the students in a test: $81, 72, 90, 90, 86, 85, 92, 70, 71, 83, 89, 95, 85, 79, 62$ The range of the marks is.
AnswerRange of observations = Highest observation - Lowest observation
$= 95 - 62 = 33$
View full question & answer→MCQ 1371 Mark
Mode of the data $15, 14, 19, 20, 14, 15, 16, 14, 15, 18, 14, 19, 15, 17, 15$ is:
AnswerWe first arrange the given data in ascending order as follows $14, 14, 14, 14, 15, 15, 15, 15, 15, 16, 17, 18, 19, 19, 20$.
From above, we see that $15$ occurs most frequently i.e., $5$ times.
Hence, the mode of the given data is $15$.
View full question & answer→MCQ 1381 Mark
In a frequency distribution, the mid-value of a class is $10$ and width of each class is $6$. The lower limit of the class is:
AnswerGiven,
Mid value of the class $= 10$
Width of each class $= 6$
Now,
Let the lower limit be $x$.
We know,
Upper limit $=$ Lower limit $+$ class size
$= x + 6$
Also,
Mid value $=\frac{\text{x}+\text{x}+6}{2}$
$=\frac{2\text{x}+6}{2}=\text{x}+3$
$\Rightarrow\text{x}+3=10$
$\Rightarrow\text{x}=7$
Thus, the lower limit is $7$.
View full question & answer→MCQ 1391 Mark
If $x$ is the mean of $x_1, x_2, \ldots . . x_n, y$ is the mean of $y_1, y_2, \ldots x_n, \ldots y_n$, then $z$ the mean of $x_1, x_2, \ldots . x_n, y_1, y_2, \ldots . y$ is equal to:
- ✓
$\frac{\text{x}+\text{y}}{2}$
- B
$\frac{\text{x}+\text{y}}{\text{n}}$
- C
$\frac{\text{x}+\text{y}}{2\text{n}}$
- D
${\text{x+y}}$
AnswerCorrect option: A. $\frac{\text{x}+\text{y}}{2}$
Since $x^{-}$and $y^{-}$are two numbers, though being means, their arithmetic mean is given by:
$\text{z}=\frac{\text{x and y}}{2}$
View full question & answer→MCQ 1401 Mark
The median and mode of distribution are $20$ and $18$, then the mean is:
Answer$3$ Median $= 2 \times $ Mean + Mode
$\Rightarrow 3 \times 20 = 2 \times $ Mean + $18$
$\Rightarrow 2 \times$ Mean $= 60 - 18 = 42$
$\Rightarrow $ Mean $= 21$
View full question & answer→MCQ 1411 Mark
More than’ cumulative frequency table for a given data is as follows: Then, the frequency of the class interval $70-80$ is:
|
Marks
|
More than $89$
|
More than $79$
|
More than $69$
|
More than $59$
|
|
Cumulative frequency
|
$8$
|
$18$
|
$30$
|
$65$
|
AnswerA cumulative frequency distribution is the sum of the class and all classes below it in a frequency distribution.
Subtract cumulative frequency of class more than $70$ from the next cummulative Frequency of class more than $69$.
$30 − 18 = 12$
View full question & answer→MCQ 1421 Mark
In a bar graph if $1\ cm$ represents $30\ km$, then the length of bar needed to represent $75\ km$ is:
- A
$3.5\ cm$
- ✓
$2.5\ cm$
- C
$2\ cm$
- D
$3\ cm$
AnswerCorrect option: B. $2.5\ cm$
$1\ cm - 30\ km$
So for $75\ km$
$\frac{75}{30}=2.5\text{cm}$
View full question & answer→MCQ 1431 Mark
Write the correct answer in the following:
Median of the following numbers, $4, 4, 5, 7, 6, 7, 7, 12, 3$ is:
AnswerFirst, we arrange the given numbers in ascending order is,
$3, 4, 4, 5, 6, 7, 7, 7$ and $12$
Here, $n = 9$
Since, $n$ is odd, so we use the formula for median,
Now, Median $=\Big(\frac{\text{n}+1}{2}\Big)^{\text{th}}\text{observation}$
$=\Big(\frac{9+1}{2}\Big)^{\text{th}}\text{observation}$ [Put $n = 9$]
$=\Big(\frac{10}{2}\Big)^{\text{th}}\text{observation}$
$=5^{\text{th}}\text{observation}=6$
View full question & answer→MCQ 1441 Mark
The marks obtained by $17$ students in a mathematics test (out of $100$) are given below: $91, 82, 100, 100, 96, 65, 82, 76, 79, 90, 46, 64, 72, 68, 66, 48, 49$. Find the range of the data.
AnswerHighest Marks $= 100$
Lowest Marks $= 46$
Range of data $= 100 - 46 = 54$
View full question & answer→MCQ 1451 Mark
If each observation of the data is decreased by $8$ then their mean:
AnswerCorrect option: C. Is decreased by $8.$
Let the numbers be $x_1, x_2 \ldots ., x_n$
Now the new numbers after decrasing every number by $8:\left(x_1-8\right),\left(x_2-8\right) \ldots\left(x_n-8\right)$
New mean $=\frac{(\text{x}_1 - 8)+(\text{x}_2 - 8)+...+(\text{x}_\text{n} - 8)}{\text{n}}$
$=\frac{\text{x}_1+\text{x}_2+...+\text{x}_\text{n}-\text{8n}}{\text{n}}$
$=\frac{\text{x}_1+\text{x}_2+...+\text{x}_\text{n}}{\text{n}}-8$
New mean $=$ mean $-8$
Hence, mean is decreased by $8.$
View full question & answer→MCQ 1461 Mark
Tallys are usually marked in a bunch of:
AnswerTallies are usually marked in a bunch of $4$.
Hence, the correct option is $(b)$.
View full question & answer→MCQ 1471 Mark
Which one of the following is not a measure of central value?
AnswerThe difference between the highest value and the lowest value in the data set is called Range.
View full question & answer→MCQ 1481 Mark
In a frequency distribution, the mid-value of a class is $15$ and the class intervals is $4$. The lower limit of the class is:
AnswerLet $l$ and $m$ respectively be the lower and upper limits of the class.
Then the mid-value of the class is $\frac{\text{l+m}}{2}$ and the class-size is $(m - l)$.
Therefore, we have two equations
$\frac{\text{l+m}}{2}=15$
$\Rightarrow l + m = 30,$
$m - l = 4$
Subtracting the second equation from the first equation, we have
$(l + m) - (m - l) = 30 - 4$
$\Rightarrow l + m - m + l = 26$
$\Rightarrow 2l = 26$
$\Rightarrow l = 13$
Hence, the lower limit of the class is $13$. Thus, the correct choice is $(c)$.
View full question & answer→MCQ 1491 Mark
In a frequency distribution, the mid-value of a class is $60.5$ and the width of the class is $10$. The lower limit of the class is:
- A
$65.5$
- B
$62.5$
- C
$56.5$
- ✓
$55.5$
AnswerCorrect option: D. $55.5$
upper limit - lower limit = class width
upper limit - lower limit $= 10$
$\frac{\text{(upper limit + lower limit)}}{2}=\text{mid}-\text{value}$
upper limit + lower limit $= 2 \times 60.5$
upper limit + lower limit $= 121$
By solving the above two equations, we get
upper limit $= 65.5$
Lower limit $= 55.5$
View full question & answer→MCQ 1501 Mark
The range of the data $12, 25, 15, 18, 17, 20, 22, 6, 16, 11, 8, 19, 10, 30, 20, 32$ is:
AnswerWe have:
Maximum value $= 32$
Minimum value $= 6$
We know:
Range = Maximum value - minimum value
$= 32 - 6$
$= 26$
View full question & answer→