Question 13 Marks
The bar graph illustrates the results of a survey conducted on vehicles crossing over a Toll Plaza in one hour.
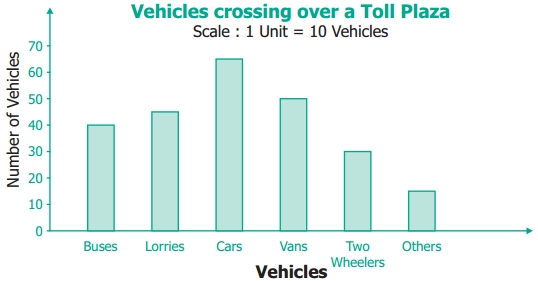
Observe the bar graph carefully and fill up the following table.
Observe the bar graph carefully and fill up the following table.
| Vehicles | Buses | _____ | Cars | Vans | _____ | Others | Total vehicles |
| Number of Vehicles |
_____ | 45 | _____ | _____ | 30 | ______ | ______ |
Answer
View full question & answer→| Vehicles | Buses | Lorries | Cars | Vans | Two Wheelers |
Others | Total Vehicles |
| Number of Vehicles |
40 | 45 | 65 | 50 | 30 | 15 | 245 |