Questions

5 marks

🎯

Test yourself on this topic

19 questions · timed · auto-graded

Question 15 Marks
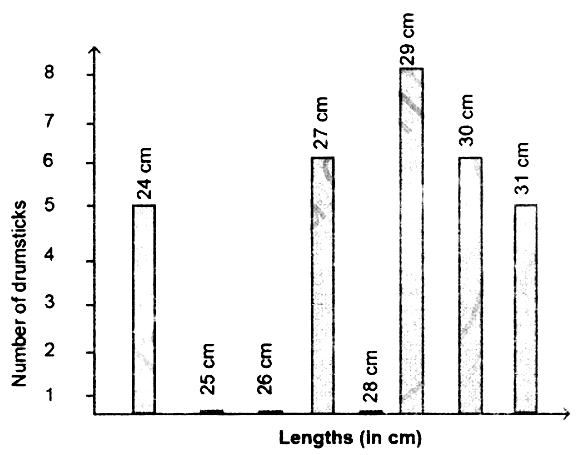
The lengths (in the nearest centimetre) of 30 drumsticks are given as follows.
Lengths Number of drumsticks
24 ||||
25 --
26 --
27 |||| |
28 --
29 |||| |||
30 |||| |
31 ||||
Draw the bar graph showing the same information.
Answer
The lengths (in nearest cm) of drumsticks
Scale: 1 Unit = 1 drumstick
View full question & answer
Question 25 Marks
Yasmin of class VI was given a task to count the number of books which are biographies, in her school library. The information collected by her is represented as follows.
Biographies Number of books
Mathematicians
Scientists
Novelists
Sportspersons
Politicians
Keys: Image
Observe the pictograph and answer the following questions.
(i) Which title has the maximum number of biographies?
(ii) Which title has the minimum number of biographies?
(iii) Which title has exactly half the number of biographies as Novelists?
(iv) How many biographies are there on the title of Sportspersons?
(v) What is the total number of biographies in the library?
Answer
(i) The title Novelists have the maximum number of biographies.
(ii) The title Scientists have the minimum number of biographies.
(iii) Sportspersons title has exactly half the number of biographies as Novelist.
(iv) $(1 \times 20)+\frac{20}{4}=20+5=25$ biographies are there in the title sportsperson.
(v) $8 \times 20=160$ biographies are there in the library.
View full question & answer
Question 35 Marks
26 students were interviewed to find out what they want to become in future. Their responses are given in the following table.
ProfessionTally marks
Teacher|||| ||
Pilot|||
Bank
Answer
Students responses in an interview about their future profession
Scale: 1 Unit = 1 student
View full question & answer
Question 45 Marks
The table shows the number of moons that orbit each of the planets in our solar system.
Planet Mercury Venus Earth Mars Jupiter Saturn Uranus Neptune
Number
of Moons
0 0 1 2 28 30 21 8
Make a Bar graph for the above data
Answer
Number of moons that orbit each of the planets in our solar system
Scale: 1 Unit = 2 moons
View full question & answer
Question 55 Marks
The prediction of Weather in the month of September is given below.

(i) Make a frequency table of the types of weather by reading the calendar.
(ii) How many days are either cloudy or partly cloudy?
(iii) How many days do not have rain? Give two ways to find the answer?
(iv) Find the ratio of the number of Sunny days to Rainy days
Answer
(i)
Type of weather Tally mark Frequency
Sunny |||| |||| 10
Partly cloudly |||| | 6
Cloudly |||| ||| 8
Rainly |||| | 6
  Total 30

(ii) 14 days.
(iii) For 24 days there is no rain.
(a) From the total 30 days, we subtract the rainy days i.e $30-6=24$ days ...(From the frequency table)
(b) From the picture, we can count the non-rainy days.
(iv) Ratio of number of Sunny day to Rainy days
$=\frac{\text { Number of Sunny days }}{\text { Number of Rainy days }}$
$=\frac{10}{6}$
$=\frac{5}{3}$
$=5: 3$
The ratio of a number of Sunny days to Rainy days $=5: 3$
View full question & answer
Question 65 Marks
There are 1000 students in a school. Data regarding the mode of transport of the students is given below. Draw a pictograph to represent the data.
Mode of Travel On Foot Bicycle Scooter Bus Car
Number of Students 350 300 150 100 100
Answer
Mode of transport of the students
Scale: 1 Unit = 100 Students
View full question & answer
Question 75 Marks
The following pictograph shows the total savings of a group of friends in a year. Each picture represents a saving of Rs.100.
Ruby
Malarkodi
Thasnim
Kuzhali
Iniya
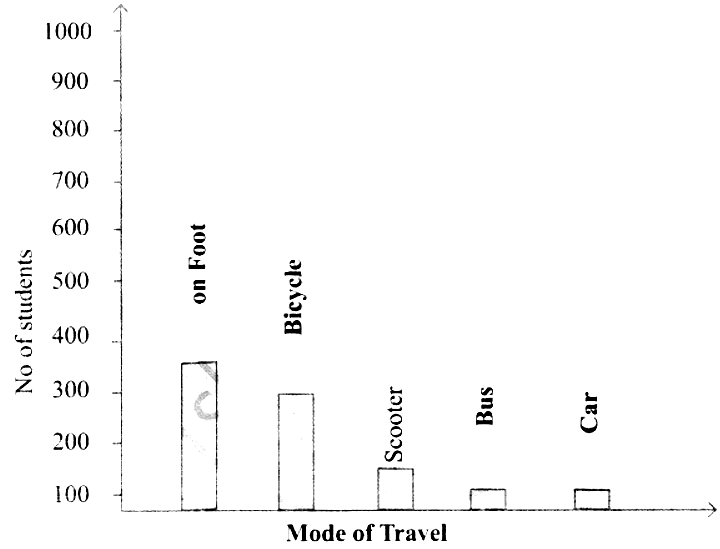
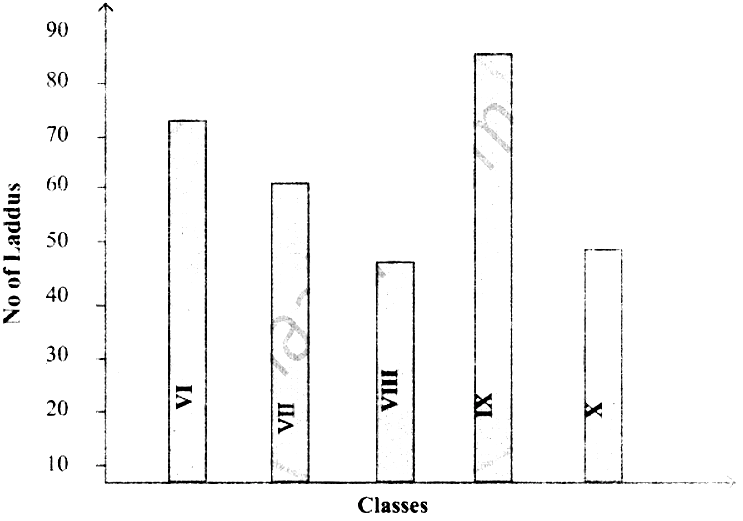
represents Rs.100Answer the following questions.
(i)
What is the ratio of Ruby’s saving to that of Thasnim’s?
(ii) What is the ratio of Kuzhali’s savings to that of others?
(iii) How much is Iniya’s savings?
(iv) Find the total amount of savings of all the friends?
(v) Ruby and Kuzhali save the same amount. Say True or False
Answer
(i) Ratio of Ruby's saving to that of Thasnim's
$ =\frac{\text { Ruby's saving }}{\text { Thasnim's saving }}$
$=\frac{5 \times 100}{4 \times 100}$
$=\frac{5}{4}$
$=5: 4 $
Ratio of Ruby's saving to that of Thasnims $=5: 4$
(ii) Ratio of Kuzhali's savings to that of others
$ =\frac{\text { Kuzhali's saving }}{\text { others saving }}$
$=\frac{5 \times 100}{19 \times 100}$
$=\frac{5}{19}$
$=5: 19 $
Ratio of Kuzhali's saving to that of others $=5: 19$
(iii) Iniya's saving $=3 \times 100=\text{\text{₹}}300$
(iv) Saving of all the friends $=(5+7+4+5+3) \times 100$
$ =24 \times 100$
$=\text{₹} 2400 . $ Total savings $=\text{₹} 2400$
(v) Ruby and Kuzhali save the same amount - True
View full question & answer
Question 85 Marks
The heights (in centimeters) of 40 children are.
110 112 112 116 119 111 113 115 118 120
110 113 114 111 114 113 110 120 118 115
112 110 116 111 115 120 113 111 113 120
115 111 116 112 110 111 120 111 120 111
Prepare a tally marks table
Answer
Height (in Cms) Tally Marks frequency
110 |||| 5
111 |||| ||| 8
112 |||| 4
113 |||| 5
114 || 2
115 |||| 4
116 ||| 3
117
118 || 2
119 | 1
120 |||| | 6
Total 40
View full question & answer
Question 95 Marks
The pictograph below gives the number of absentees on different days of the week in class six. Draw the Bar graph for the same.
DayMondayTuesdayWednesdayThursdayFridaySaturday
Number of Absentees--
represents 4 students represents 2 students
Answer
No of absentees on different days of the week in a class
Scale: 1 unit = 2 students
View full question & answer
Question 105 Marks
The fruits liked by the students of a class are as follow: Draw a Bar Graph for this data.
Fruits Bananas Grapes Apples Mangoes Guavas Papayas Other fruits
Number of
students
8 10 8 7 12 3 2
Answer
Draw a bar graph for data this data
Scale: 1 unit = 2 fruits
View full question & answer
Question 115 Marks
Chitra has to buy Laddus in order to distribute to her friends as follow: Draw a Bar Graph for this data
Classes VI VII VIII IX X
Number of Laddus 70 60 45 80 55
Answer
Distribution of Laddus by Chitra to her friends
Scale: 1 unit = 10 Laddus
View full question & answer
Question 125 Marks
Read the given Bar Graph which shows the percentage of marks obtained by Brinda in different subjects in an assessment test.
Image
Observe the Bar Graph and answer the following questions.
(i) 1 Unit = __________% of marks on vertical line.
(ii) Brinda has scored maximum marks in __________ subject.
(iii) Brinda has scored minimum marks in __________ subject.
(iv) The percentage of marks scored by Brinda in Science is __________.
(v) Brinda scored 60% marks in the subject __________.
(vi) Brinda scored 20% more in __________ subject than __________ subject.
Answer
(i) 1 Unit = 10% of marks on vertical line.
(ii) Brinda has scored maximum marks in Mathematics subject.
(iii) Brinda has scored minimum marks in Language subject.
(iv) The percentage of marks scored by Brinda in Science is 65%.
(v) Brinda scored 60% marks in the subject English.
(vi) Brinda scored 20% more in Mathematics subject than Science subject.
View full question & answer
Question 135 Marks
The following Pictograph shows the number of students playing different games in a school.
Game Number of Students
Kho-Kho
Kabaddi
Basketball
Volleyball
Hockey
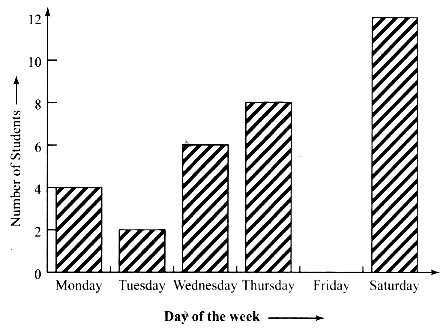
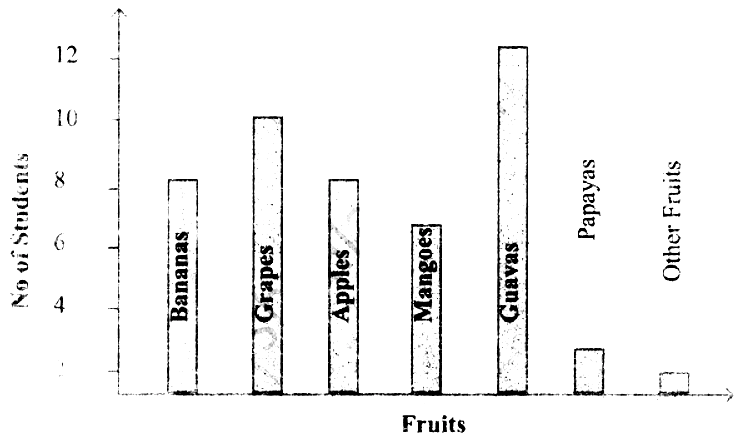
Represents 10 students
Answer the following questions.
(i) Which is the most popular game among the students?
(ii) Find the number of students playing Kabaddi.
(iii) Which two games are played by equal number of students?
(iv) What is the difference between the number of students playing Kho-Kho and Hockey?
(v) Which is the least popular game among the students?
Answer
(i) Kabaddi is the most popular game among students.
(ii) There are 11 × 10 = 110 students playing kabaddi.
(iii) Kho-Kho and Hockey are played by an equal number of students.
(iv) Difference is 90 – 90 = 0.
(v) Basketball is the least popular game among students.
View full question & answer
Question 145 Marks
The following table shows the number of tourists who visited the places in the month of May. Draw a pictograph
Place Mahabalipuram Vedanthangal Hogenakkal Ooty
Number of Tourists 20,000 15,000 40,000 35,000
(Choose your own suitable scale)
Answer
Number of Tourists who visited the places in the month of May.
Scale : 1 Unit = 10000 Visitors
View full question & answer
Question 155 Marks
Draw a pictograph for the given data.
Month June July August September
Number of Computers sold 300 450 600 550
(Choose your own suitable scale)
Answer
Number of computers sold
Scale : 1 Unit = 100 computers
Image
View full question & answer
Question 165 Marks
The table shows the number of calls recorded by a Fire Service Station in one year.
Types of Calls Tally Marks Frequency
Building Fires |||| |
Other Fires |||| |||| |
Hazardous Materials 7
Rescues 4
False Alarms |||| ||
Total
Complete the table and answer the following questions.
(i) Which type of call was recorded the most?
(ii) Which type of call was recorded the least?
(iii) How many calls were recorded in all?
(iv) How many calls were recorded as False Alarms?
Answer
The completed table is given below.
Types of Calls Tally Marks Frequency
Building Fires |||| | 6
Other Fires |||| |||| | 11
Hazardous Materials |||| || 7
Rescues |||| 4
False Alarms |||| || 7
Total 35
(i) The call for Other Fires was recorded the most (ii) The call for Rescues was recorded the least (iii) The total of 35 calls was recorded (iv) There are 7 calls were recorded as False alarms.
View full question & answer
Question 175 Marks
The following are the marks obtained by 30 students in a class test out of 20 in Mathematics subject.
11121312121516171812
20131314141415151515
16161615141312111917
Prepare a table using Tally Marks
Answer
We prepare a table using Tally Marks as
Number Tally Marks Frequency
11 || 2
12 |||| 5
13 |||| 4
14 |||| 4
15 |||| | 6
16 |||| 4
17 || 2
18 | 1
19 | 1
20 | 1
Total 30
View full question & answer
Question 185 Marks
The following list tells colours liked by 25 students. Prepare a table using Tally Marks.
Red Blue White Grey White
Green Grey Blue Green Grey
Blue Grey Red Green Red
Blue Blue Green Blue Green
Grey Grey Green Grey Red
Answer
We prepare the table using Tally marks as
Colours Tally Marks Frequency
Red |||| 4
Blue |||| | 6
White || 2
Grey |||| || 7
Green ||||| 6
Total 25
View full question & answer
Question 195 Marks
Viji threw a die 30 times and noted down the result each time as follows. Prepare a table on the numbers shown using Tally Marks.
143556643545652
423556645665411
Answer
We prepare a table using tally marks from the given information
Face of dieTally marksFrequency
1|||3
2||2
3||2
4|||| |6
5 |||| ||||9
6 |||| |||8
Total30
View full question & answer
5 marks - Maths STD 6 Questions - Vidyadip