Question 11 Mark
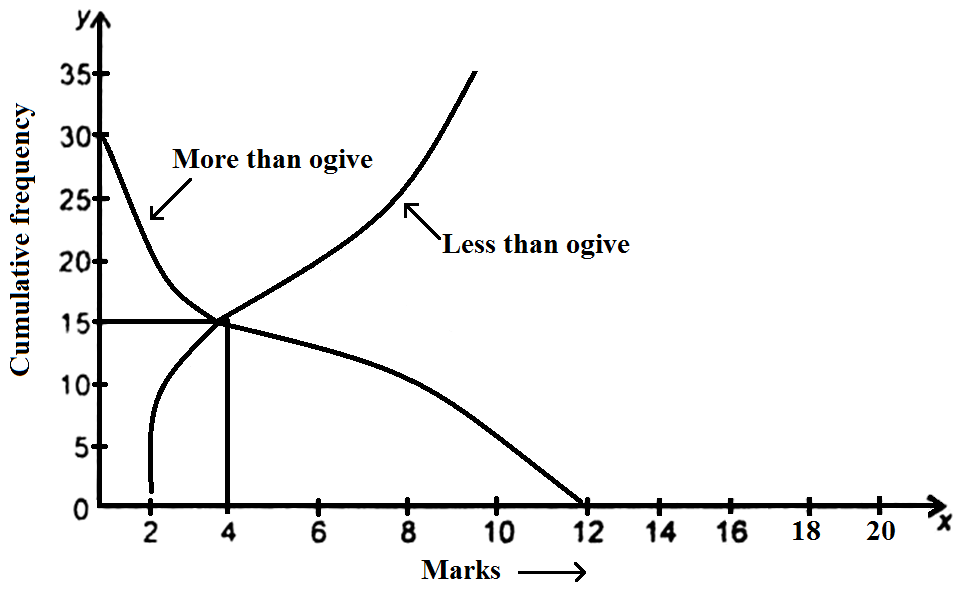
Which measure of central tendency is given by the x-coordinate of the point of intersection of the 'more than' ogive and 'less than' ogive?
Answer
View full question & answer→Median is given by the x-coordinate of the point of intersection of the 'more than' ogive and 'less than' ogive.