MCQ 1011 Mark
Which political party won the maximum number of seats?
- ✓$A$
- B$B$
- C$C$
- D$D$
Answer
View full question & answer→Correct option: A.
$A$
$\begin{aligned} & \text { Hyderabad }=7 \odot=4200 \odot=\frac{4200}{7}=600 \text { chenna } 5 \odot=3000 \\ & 1 \bigodot=\frac{3000}{5}=600\end{aligned}$
Table with tally marks from the given information is shown below:
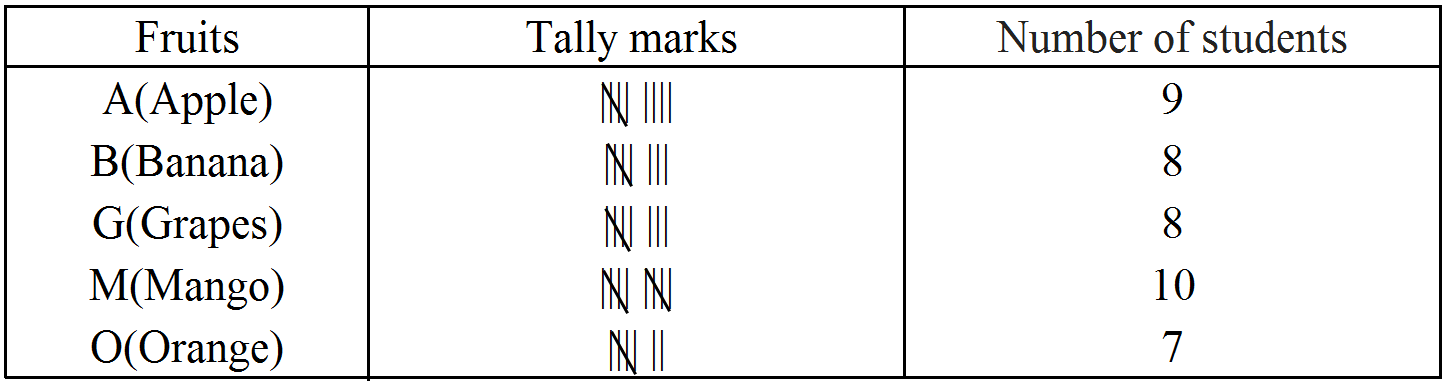
From the table, we can observe that banana and grapes are liked by equal number of students, i.e. $8.$
$700 + 600 + 500 + 400 + 400 = 2600$
$\text{Delhi}=\Box\times7=4200\ \Box\times1=\frac{4200}{7}=600\ \Box=600$
Total electricity produced during the last two years
i.e., in year $2006$ and year $2007 = 50.28 + 75.53 = 125.81$ million kilcwatt.
$700 - 600 = 100$
$55, 36, 42, 25$
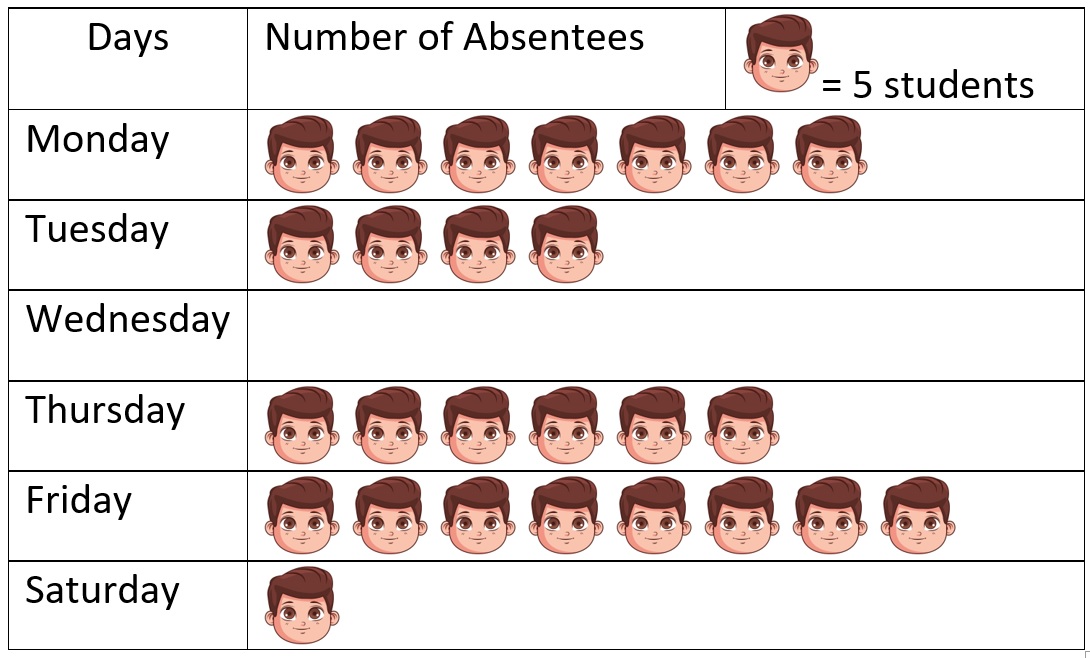
A pictograph uses pictures or symbols to represent an assigned amount of data.
Collection of data = information facts and statistics collected together for reference or analysis is called data.
$12 + 7 = 19$
$6 : 12 = 1 : 2$
|
Class Interval
|
Frequency
|
|
$0 – 10$
|
$1$
|
|
$10 – 20$
|
$6$
|
|
$20 – 30$
|
$20$
|
|
$30 – 40$
|
$12$
|
|
$40 – 50$
|
$6$
|
|
Total
|
45
|
Both have $6$ frequency
We have given that $7$ smiley is equal to $4200.$
So one smiley $=\frac{4200}{7}=600$
$40 - 10 = 30$
$400 : 400 = 1 : 1$
$C \rightarrow 20, D \rightarrow 20$
From the table of question $4$, we can observe that mango is liked by most of the students.