A survey was carried out in a certain school to find about different modes of transport used by students to travel to school each day. $30$ students of class $VI$ were interviewed and the data obtained was displayed in the form of a pictographs given below: 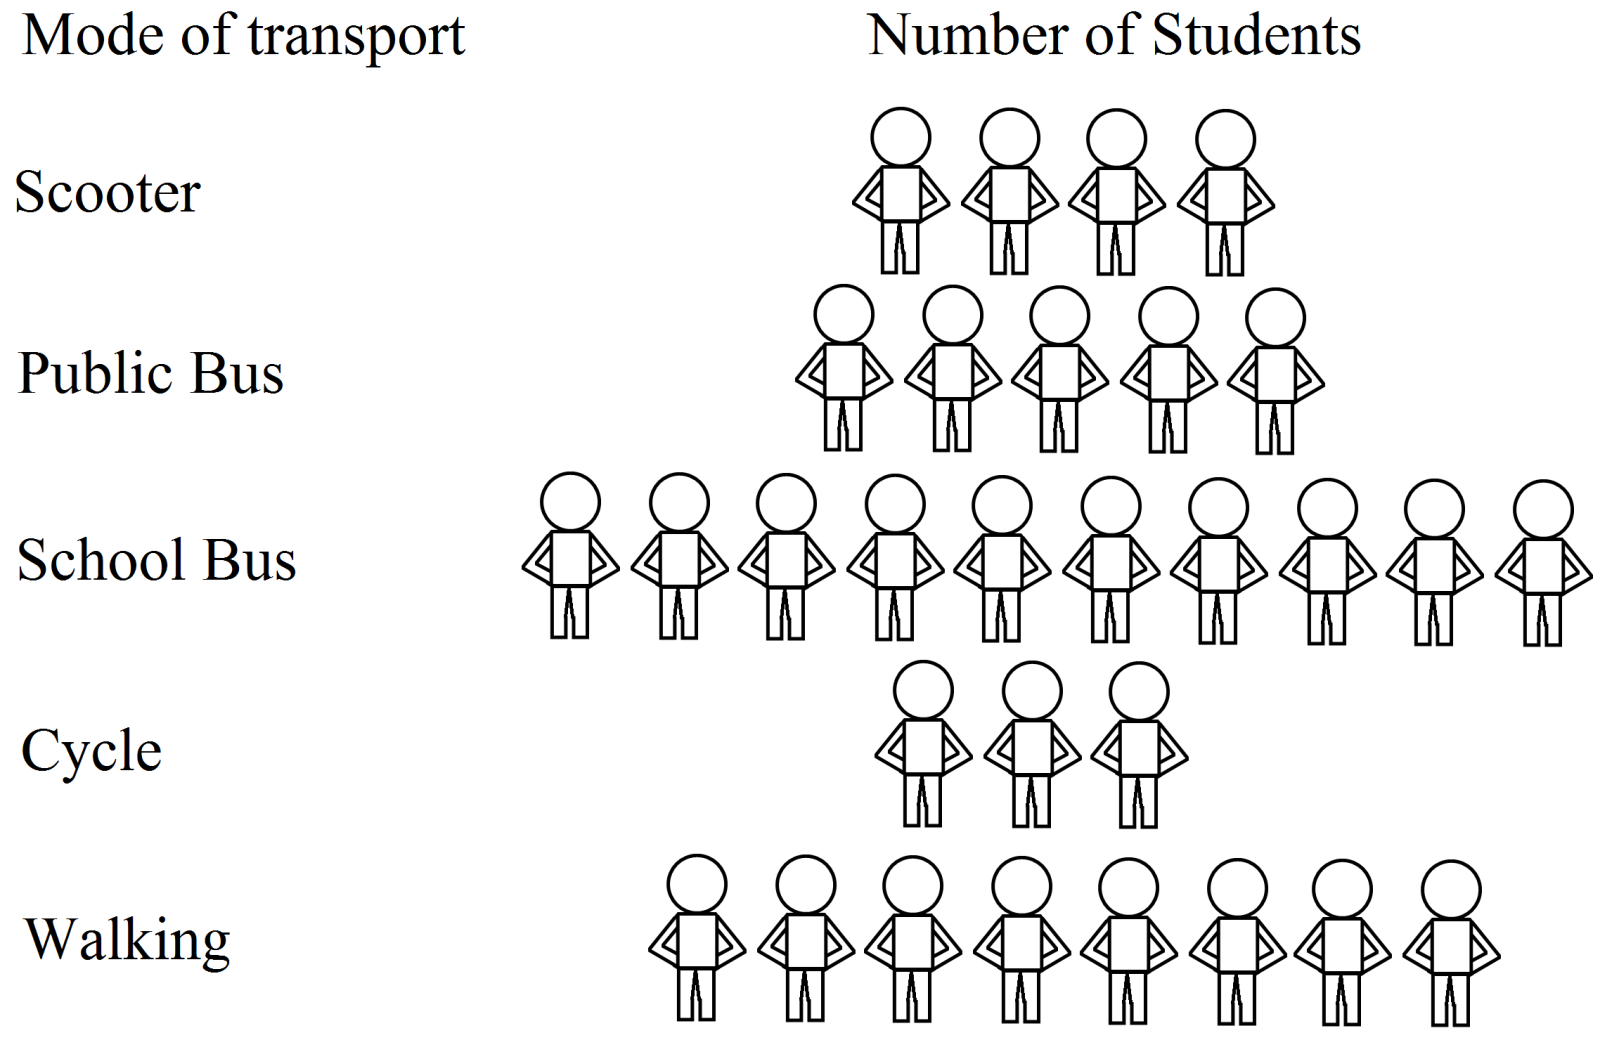
Look at the above pictograph and answer the following questions:
$i.\ $Look at the above pictograph and answer the following questions:
$ii.\ $How many students are using cycle or walking as a mode of travel?
$iii.\ $Which is most popular mode of travel?
View full solution →Look at the above pictograph and answer the following questions:
$i.\ $Look at the above pictograph and answer the following questions:
$ii.\ $How many students are using cycle or walking as a mode of travel?
$iii.\ $Which is most popular mode of travel?