Sample QuestionsData Handling questions
One sample from each question group in this chapter. Select any group above to see the full set with answer keys.
The Arithmetic Mean of the following data is.
Answer: B.
View full solution →In which class is the number of students $500?$
Answer: A.
View full solution →What is the number of houses represented by the figure $⌅⌅⌅⌅$ if each symbol represents 15 houses?
Answer: A.
View full solution →A pictorial representation of data is called:
Answer: A.
View full solution →Direction: Answer the following set of questions by reading the pictograph given.
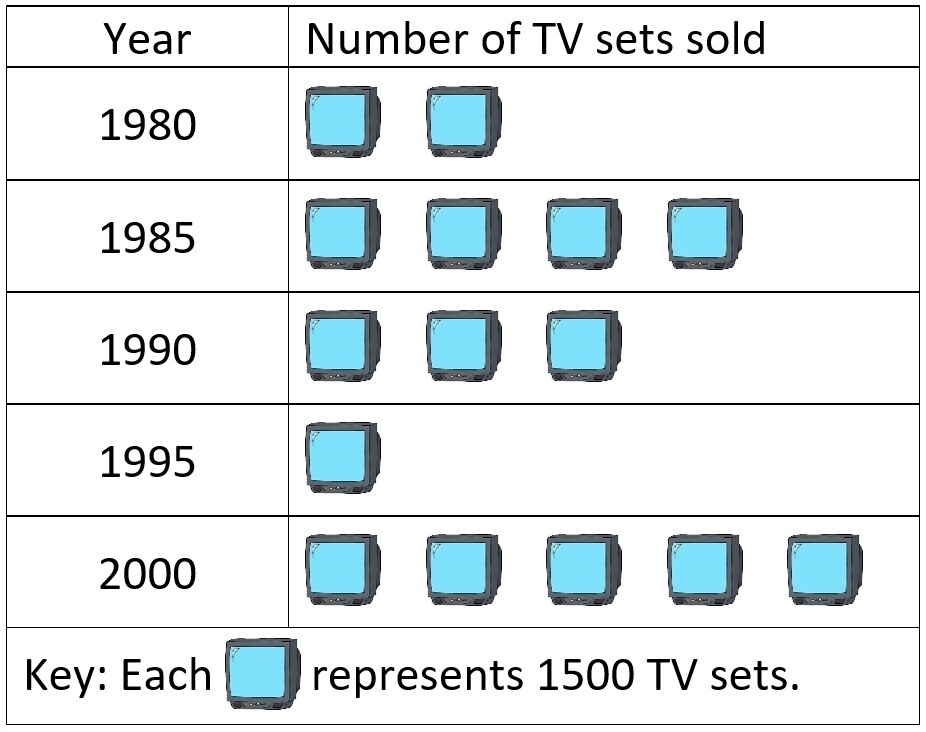
What is the number of $TV$ sets sold in the year 1980? - ✓
$3000$
- B
$1500$
- C
$1250$
- D
$2000$
Answer: A.
View full solution →Directions: In the following questions, the Assertions $(A)$ and Reason(s) $(R)$ have been put forward. Read both the statements carefully and choose the correct alternative from the following:
Assertion (A): Observe the following bar graph and consider it as assertions for the next questions:

Reason (R): Political party Cwon the minimum number of seats. - ✓
Both $A$ and $R$ are true and $R$ is the correct explanation of $A$
- B
Both $A$ and $R$ are true but $R$ is not the correct explanation of $A$
- C
$A$ is true but $R$ is false
- D
$A$ is false but $R$ is true
Answer: A.
View full solution →Directions: In the following questions, the Assertions $(A)$ and Reason(s) $(R)$ have been put forward. Read both the statements carefully and choose the correct alternative from the following:
Assertion (A): The maximum marks obtained by any student is $95$ out of $100$
Reason (R): Data is a collection of numbers gathered to give some information.
- A
Both $A$ and $R$ are true and $R$ is the correct explanation of $A$
- B
Both $A$ and $R$ are true but $R$ is not the correct explanation of $A$
- C
$A$ is true but $R$ is false
- ✓
$A$ is false but $R$ is true
Answer: D.
View full solution →Directions: In the following questions, the Assertions $(A)$ and Reason(s) $(R)$ have been put forward. Read both the statements carefully and choose the correct alternative from the following:
Assertion (A): The difference between maximum and minimum frequency is $9.$
Reason (R):
|
Blood Groups
|
Number of students
|
|
$A$
|
$9$
|
|
$B$
|
$6$
|
|
$O$
|
$12$
|
|
$AB$
|
$3$
|
|
Total
|
$30$
|
- ✓
Both $A$ and $R$ are true and $R$ is the correct explanation of $A$
- B
Both $A$ and $R$ are true but $R$ is not the correct explanation of $A$
- C
$A$ is true but $R$ is false
- D
$A$ is false but $R$ is true
Answer: A.
View full solution →Directions: In the following questions, the Assertions $(A)$ and Reason(s) $(R)$ have been put forward. Read both the statements carefully and choose the correct alternative from the following: Assertion (A):
|
Blood Groups
|
Number of students
|
|
$A$
|
$9$
|
|
$B$
|
$6$
|
|
$O$
|
$12$
|
|
$AB$
|
$3$
|
|
Total
|
$30$
|
Reason (R): The most common blood group is $B.$ - A
Both $A$ and $R$ are true and $R$ is the correct explanation of $A$
- B
Both $A$ and $R$ are true but $R$ is not the correct explanation of $A$
- C
$A$ is true but $R$ is false
- ✓
$A$ is false but $R$ is true
Answer: D.
View full solution →Directions: In the following questions, the Assertions $(A)$ and Reason(s) $(R)$ have been put forward. Read both the statements carefully and choose the correct alternative from the following:
Assertion (A): Observe the following bar graph and consider it as assertions for the next questions: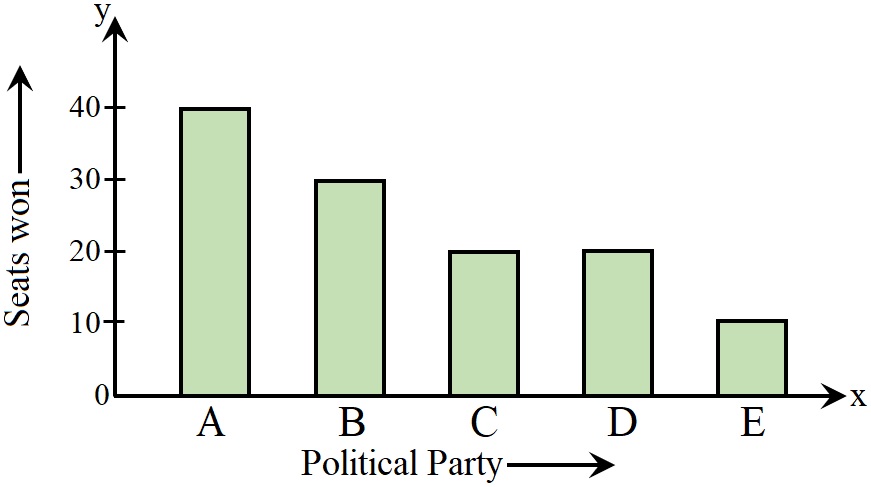
Reason (R): The total number of seats won by party $C$ and party $D$ is $30.$ - A
Both $A$ and $R$ are true and $R$ is the correct explanation of $A$
- B
Both $A$ and $R$ are true but $R$ is not the correct explanation of $A$
- C
$A$ is true but $R$ is false
- ✓
$A$ is false but $R$ is true
Answer: D.
View full solution →Pictographs and bar graphs are pictorial representations of the numerical data.
$a.$ True $b.$ False
View full solution →If the scale along $Y-$axis is $1$ unit $10$ girls, then a bar of height $2.$5units will represent……….girls. $(25, 20, 30)$
View full solution →If the scale along $Y-$axis is $I$ unit $= 4$ books, then a bar of height 5$$ unitswill represent………..books. $(9$ books, $1$ book, $20$ books$)$
View full solution →If the scale along $Y-$axis is $1$ unit $5$ students, then a bar of height ………… units will represent $30$ students. $(5. 1. 6)$
View full solution →In a bar graph, the ……….. of each bar gives the required information. (height. breadth, thickness)
In a bar graph, every bar is in the shape of a……….. (triangle. rectangle, square)
The sale of electric bulbs on different days of a week is shown below:
| Days |
Number of electric bulbs  $- 2$ Bulbs $- 2$ Bulbs |
| Monday |
 |
| Tuesday |
 |
| Wednesday |
 |
| Thursday |
 |
| Friday |
 |
| Saturday |
 |
| Sunday |
 |
On which of the days minimum number of bulbs were sold? View full solution →The sale of electric bulbs on different days of a week is shown below:
| Days |
Number of electric bulbs $- 2$ Bulbs |
| Monday |
|
| Tuesday |
|
| Wednesday |
|
| Thursday |
|
| Friday |
|
| Saturday |
|
| Sunday |
|
On which of the days same number of bulbs were sold? View full solution →The sale of electric bulbs on different days of a week is shown below:
| Days |
Number of electric bulbs $- 2$ Bulbs |
| Monday |
|
| Tuesday |
|
| Wednesday |
|
| Thursday |
|
| Friday |
|
| Saturday |
|
| Sunday |
|
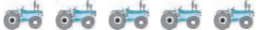
On which day were the maximum number of bulbs sold? View full solution →Following pictograph shows the number of tractors in five villages:
| Villages |
Number of tractors  $- 1$ Tractor $- 1$ Tractor |
| Village $A$ |
 |
| Village $B$ |
 |
| Village $C$ |
 |
| Village $D$ |
 |
| Village $E$ |
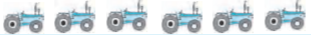 |
What is the total number of tractors in all the five villages$?$ View full solution →Following pictograph shows the number of tractors in five villages:
| Villages |
Number of tractors $- 1$ Tractor |
| Village $A$ |
|
| Village $B$ |
|
| Village $C$ |
|
| Village $D$ |
|
| Village $E$ |
|
How many more tractors village $C$ has as compared to village $B.$ View full solution →Following is the choice of sweets of 30 students of class $VI :$ Ladoo, Barfi, Ladoo, Jalebi, Ladoo, Rasgulla, Jalebi, Ladoo, Barfi, Rasgulla, Ladoo, Jalebi, Jalebi, Rasgulla, Ladoo, Rasgulla, Jalebi, Ladoo, Rasgulla, Ladoo, Ladoo, Barfi, Rasgulla, Rasgulla, Jalebi, Rasgulla, Ladoo, Rasgulla, Jalebi, Ladoo.
$i.\ $ Arrange the name of sweets in a table using tally marks.
$ii.\ $ Which sweet is preferred by most of the students?
View full solution →The colours of fridges preferred by people living in a locality are shown by the pictograph:
How many people liked red colour$?$
| Colours |
Number of People  $- 10$ people $- 10$ people |
| Blue |
 |
| Green |
 |
| Red |
 |
| White |
 |
View full solution →Ekta is asked to collect data for size of shoes of students in her Class $VI.$ Her finding are recorded in the manner shown below:
$5, 4, 7, 5, 6, 7, 6, 5, 6, 6, 5, 4, 5, 6, 8, 7, 4, 6, 5, 6, 4, 6, 5, 7, 6, 7, 5, 7, 6, 4, 8, 7$
Javed wanted to know
$i.\ $the size of shoes worn by the maximum number of students.
$ii.\ $the size of shoes worn by the minimum number of students.
Can you find this information?
View full solution →The number of girl students in each class of a co$-$educational middle school is depicted by the pictograph :
| Classes |
Number of girls students  $- 4$ Girls $- 4$ Girls |
| $I$ |
 |
| $II$ |
 |
| $III$ |
 |
| $IV$ |
 |
| $V$ |
 |
| $VI$ |
 |
| $VII$ |
 |
| $VIII$ |
 |
Observe this pictograph and answer the following questions:
$a.$ Which class has the minimum number of girl students?
$b.$ Is the number of girls in Class $VI$ less than the number of girls in Class $V$?
$c.$ How many girls are there in Class $VII$? View full solution →Following is the pictograph of the number of wrist watches manufactured by a factory in a particular week.
| Days |
Number of wrist watches manufactured  $=100$ Wrist Watches $=100$ Wrist Watches |
| Monday |
 |
| Tuesday |
 |
| Wednesday |
 |
| Thursday |
 |
| Friday |
 |
| Saturday |
 |
$i.\ $On which day were the least number of wrist watches manufactured?
$ii.\ $On which day were the maximum number of wrist watches manufactured?
$iii.\ $Find out the approximate number of wrist watches manufactured in the particular week? View full solution →A teacher wants to know the choice of food of each student as part of the mid-day meal programme. The teacher assigns the task of collecting this information to Maria. Maria does so using a paper and a pencil. After arranging the choices in a column, she puts against a choice of food one $(|)$ mark for every student making that choice
| Choice |
Number of students |
| Rice only |
 |
| Chapati only |
 |
| Both rice and chapati only |
 |
View full solution →In a village six fruit merchants sold the number of fruit baskets in a particular season:
| Number of fruit merchants |
Number of fruit baskets  $- 100$ Fruit baskets $- 100$ Fruit baskets |
| Rahim |
 |
| Lakhanpal |
 |
| Anwar |
 |
| Martin |
 |
| Ranjit Singh |
 |
| Joseph |
 |
Observe this pictograph and answer the question:
The merchants who have sold 600 or more number of baskets are planning to buy a godown for the next season. Can you name them? View full solution →In a village six fruit merchants sold the number of fruit baskets in a particular season:
| Number of fruit merchants |
Number of fruit baskets $- 100$ Fruit baskets |
| Rahim |
|
| Lakhanpal |
|
| Anwar |
|
| Martin |
|
| Ranjit Singh |
|
| Joseph |
|
Observe this pictograph and answer the question: How many fruit baskets were sold by Anwar? View full solution →In a village six fruit merchants sold the number of fruit baskets in a particular season:
| Number of fruit merchants |
Number of fruit baskets $- 100$ Fruit baskets |
| Rahim |
|
| Lakhanpal |
|
| Anwar |
|
| Martin |
|
| Ranjit Singh |
|
| Joseph |
|
Observe this pictograph and answer the question: Which merchant sold the maximum number of baskets? View full solution →The sale of electric bulbs on different days of a week is shown below:
| Days |
Number of electric bulbs $- 2$ Bulbs |
| Monday |
|
| Tuesday |
|
| Wednesday |
|
| Thursday |
|
| Friday |
|
| Saturday |
|
| Sunday |
|
If one big carton can hold 9 bulbs. How many cartons were needed in the given week? View full solution →The sale of electric bulbs on different days of a week is shown below:
| Days |
Number of electric bulbs $- 2 $ Bulbs |
| Monday |
|
| Tuesday |
|
| Wednesday |
|
| Thursday |
|
| Friday |
|
| Saturday |
|
| Sunday |
|
How many bulbs were sold on Friday? View full solution →