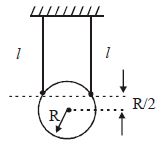
A disc of mass $m$ and radius $R$ is attached to celling with the help of ropes of length $l$. Find the time period of small oscillation of disc in the plane of disc.
Medium


Download our appand get started for free
Experience the future of education. Simply download our apps or reach out to us for more information. Let's shape the future of learning together!No signup needed.*
Similar Questions
- 1A solid cylinder of density $\rho_0$, cross-section area $A$ and length $l$ floats in a liquid $\rho(> \rho_0)$ with its axis vertical, as shown. If it is slightly displaced downward and released, the time period will beView Solution

- 2A particle moves on $x-$ axis according to the equation $x = x_0\,\,sin^2\,\omega t,$ the motion is simple harmonicView Solution
- 3The amplitude of a particle executing $SHM$ about $O$ is $10\, cm.$ Then :View Solution
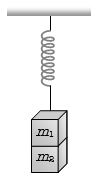
- 4Two masses $m_1$ and $m_2$ are suspended together by a massless spring of constant $K$. When the masses are in equilibrium, $m_1$ is removed without disturbing the system. The amplitude of oscillations isView Solution
- 5A spring of force constant $k$ is cut into two pieces such that one piece is double the length of the other. Then the long piece will have a force constant ofView Solution
- 6The bob of a simple pendulum of mass m and total energy $E$ will have maximum linear momentum equal toView Solution
- 7The frequency of oscillation of a mass $m$ suspended by a spring is $v_1$. If length of spring is cut to one third then the same mass oscillates with frequency $v_2$, thenView Solution
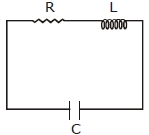
- 8An $LCR$ circuit is equivalent to a damped pendulum. In an $LCR$ circuit the capacitor is charged to $Q_0$ and then connected to the $L$ and $R$ as shown below.View Solution
If a student plots graphs of the square of maximum charge $( Q_{Max} ^2 )$ on the capacitor with time$(t)$ for two different values $L_1$ and $L_2 (L_1 > L_2)$ of $L$ then which of the following represents this graph correctly? (plots are schematic and not drawn to scale)
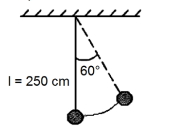
- 9A pendulum is suspended by a string of length $250\,cm$. The mass of the bob of the pendulum is $200\,g$. The bob is pulled aside until the string is at $60^{\circ}$ with vertical as shown in the figure. After releasing the bob. the maximum velocity attained by the bob will be________ $ms ^{-1}$. (if $g=10\,m / s ^{2}$ )View Solution
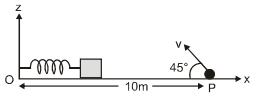
- 10A small block is connected to one end of a massless spring of un-stretched length $4.9 \ m$. The other end of the spring (see the figure) is fixed. The system lies on a horizontal frictionless surface. The block is stretched by $0.2$ $m$ and released from rest at $t =0$. It then executes simple harmonic motion with angular frequency $\omega=\frac{\pi}{3} \ rad / s$.View Solution
Simultaneously at $t=0$, a small pebble is projected with speed $v$ from point $P$ at an angle of $45^{\circ}$ as shown in the figure. Point $P$ is at a horizontal distance of $10 \ cm$ from $O$. If the pebble hits the block at $t=1 \ s$, the value of $v$ is (take $g =10 \ m / s ^2$ )