An economy is in equilibrium. From the following data, calculate the marginal propensity to save:
- Income = 10,000
- Autonomous consumption = 500
- Consumption expenditure = 8,000
CBSE OUTSIDE DELHI - SET 3 2017
Download our app for free and get started
$\text{C}=\overline{\text{C}}+\text{mpc}\left({\text{Y}}\right)$$8000=500+\text{mpc}\left(10000\right)$
$\text{mpc}=\frac{7500}{10000}=0.75$
${\text {so mps}}= 1-0.75=0.25{\text{ }\text{or}}\frac{1}{4}$
$\text{mpc}=\frac{7500}{10000}=0.75$
${\text {so mps}}= 1-0.75=0.25{\text{ }\text{or}}\frac{1}{4}$

Download our appand get started for free
Experience the future of education. Simply download our apps or reach out to us for more information. Let's shape the future of learning together!No signup needed.*
Similar Questions
- 1View SolutionWhat are two alternative ways of determining equilibrium level of income? How are these related?
- 2View SolutionThe savings function of an economy is S = -200 + 0.25Y. The economy is in equilibrium when income is equal to ₹ 2,000.
Calculate:- Investment expenditure at equilibrium level of income.
- Autonomous consumption.
- 3View SolutionExplain the relationship between marginal propensity to consume and investment multiplier.
- 4View SolutionDifferentiate between APC and APS and tell which of them is negative.
- 5View SolutionExplain the working of investment multiplier with the help of an example.
- 6View SolutionCalculate autonomous consumption expenditure from the following data about an economy which is in equilibrium.National income= 1200Marginal propensity to save= 0.20Investment expenditure= 100
- 7View SolutionIn an economy, an increase in investment leads to increase in national income which is three times more than the increase in investment. Calculate marginal propensity to consume.
- 8View SolutionCalculate APC and APS from the following schedule.Income (Y)100200300Consupmtion (C)80160240
- 9View SolutionExplain the meaning of investment multiplier. What can be its minimum and maximum value and why?
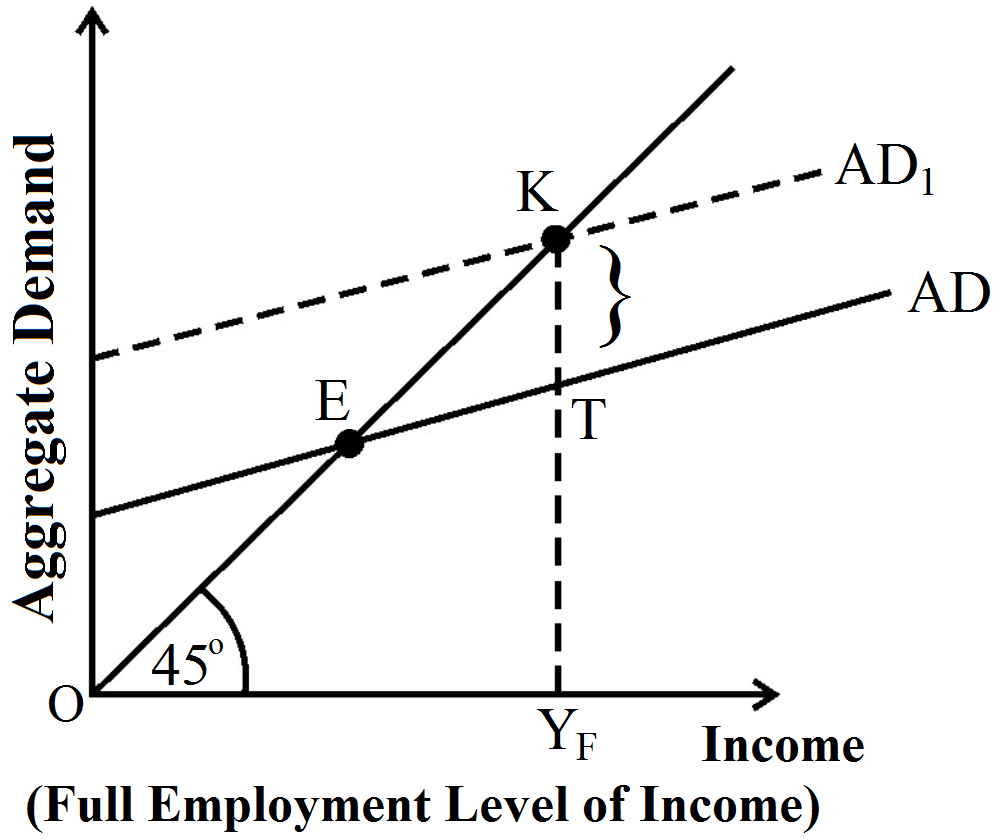
- 10View SolutionIn the given figure, what does the gap ‘KT’ represent? State any two fiscal measures to correct the situation.