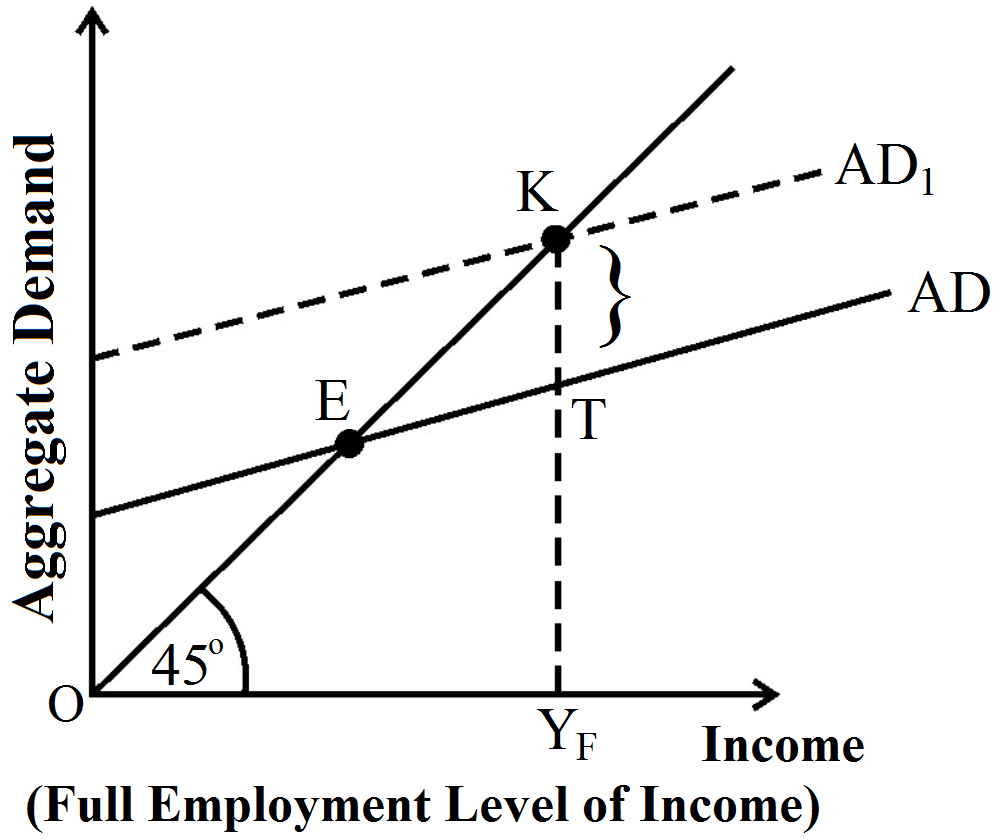
In the given figure, what does the gap ‘KT’ represent? State any two fiscal measures to correct the situation.
CBSE 58-1-1 PAPER SET 2019
Download our app for free and get started
The gap 'KT' represents the inflationary gap. This is the situation of excess demand.
Fiscal policy refers the policy that is undertaken by the government to influence the economy through the process of its expenditure and taxation. The fiscal measures to correct the excess demand are given as follows:
Fiscal policy refers the policy that is undertaken by the government to influence the economy through the process of its expenditure and taxation. The fiscal measures to correct the excess demand are given as follows:
- Government Expenditure: The Government of a country incurs various types of expenditure to enhance the welfare of the people and also to facilitate economic growth and development. In case of excess demand, the government cuts down its expenditures in form of disinvestment. This lowers the level of economic activity, which in turn, reduces the level of employment, thereby reducing the income level. This subsequently reduces the aggregate demand, thus, the situation of excess demand gets corrected.
- Public Borrowings: Through the measure of public borrowings, the government affects the liquidity (cash balances) held by the public. It is because of the excess liquidity, the people demands more and vice - versa. Therefore, government affects the liquidity balances with the help of public borrowings.

Download our appand get started for free
Experience the future of education. Simply download our apps or reach out to us for more information. Let's shape the future of learning together!No signup needed.*
Similar Questions
- 1View SolutionAn economy is in equilibrium. From the following data calculate investment expenditure:
- Marginal propensity to consume = 0·9
- Autonomous consumption = 200
- Level of income = 10000
- 2View SolutionThe break-even level of income for an economy is given to be ₹ 5000 crore. If the economy saves 50 percent of additional income, calculate the value of autonomous consumption.
- 3View SolutionExplain the meaning of deflationary gap with the help of a diagram.
OR
Explain with the help of a diagram the concept of deficient demand in macroeconomics. - 4View SolutionWhat is ex-Ante consumption? Distinguish between autonomous consumption and induced consumption.
- 5View SolutionThe savings function of an economy is S = -200 + 0.25Y. The economy is in equilibrium when income is equal to ₹ 2,000.
Calculate:- Investment expenditure at equilibrium level of income.
- Autonomous consumption.
- 6View SolutionExplain the relationship between marginal propensity to consume and investment multiplier.
- 7View SolutionAn economy is in equilibrium. Calculate the Investment Expenditure from the following:
National Income = 800
Marginal Propensity to Save = 0·3
Autonomous Consumption = 100 - 8View SolutionIf planned saving is less than planned investment, what changes will bring economy in equilibrium?
- 9View SolutionExplain the determination of equilibrium level of income using AD = AS approach.
OR
Explain with the help of a diagram, how aggregate demand and aggregate supply determine the equilibrium level of income. - 10View SolutionDifferentiate between APC and MPC.