MCQ
An ideal gas undergoes a reversible isothermal expansion from state $I$ to state $II$ followed by a reversible adiabatic expansion from state $II$ to state $III$. The correct plot($s$) representing the changes from state $I$ to state $III$ is(are)

( $p$ : pressure, $V$ : volume, $T$ : temperature, $H$ : enthalpy, $S$ : entropy)
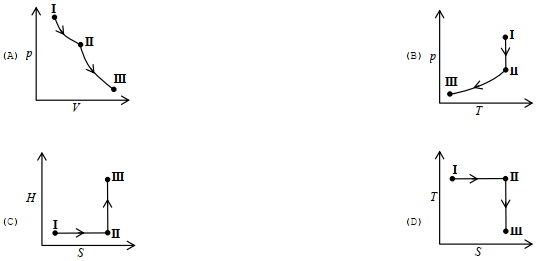
  • $A,B,D$
  • B
    $A,B,C$
  • C
    $A,B$
  • D
    $A,D$

Answer

Correct option: A.
$A,B,D$
a
From state $I$ to $II$ (Reversible isothermal expansion)

$\Rightarrow P$ decreases, $V$ increases, $T$ constant

$H$ constant & $S$ increases.

From state $II$ to $III$ (Reversible adiabatic expansion)

$\Rightarrow P$ decreases, $V$ increases, $T$ decreases

$H$ decreases, $S$ constant

$\therefore$ Plots $(A), (B), (D)$ are correct while $(C)$ is wrong as from $II$ to $III$, $H$ is decreasing.

Need a full question paper?

Generate a complete, print-ready paper with questions like this in minutes — across 16+ boards, with answer keys.

Start Generating Free