MCQ
Choose the correct answer.
The inequality representing the following graph is:
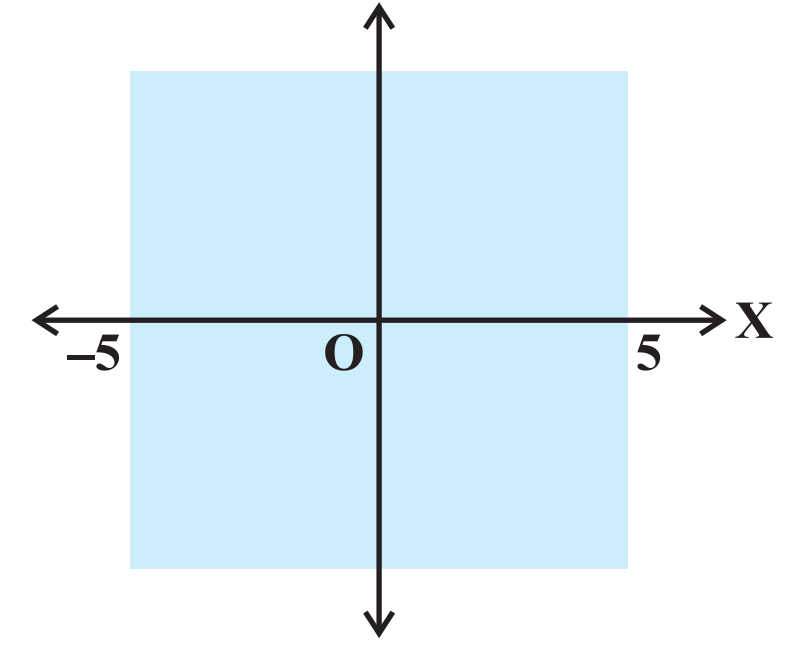
The inequality representing the following graph is:
- A$|\text{x}|>5$
- B$|\text{x}|\leq5$
- C$|\text{x}|>5$
- D$|\text{x}|\geq5$
Solution:
The given graph represents
x > -5 and x < 5
Combining the two inequalities
|x| > 5.
Generate a complete, print-ready paper with questions like this in minutes — across 16+ boards, with answer keys.
Following are the marks obtained by 9 students in a mathematics test: 50, 69, 20, 33, 53, 39, 40, 65, 59 The mean deviation from the median is: