Question
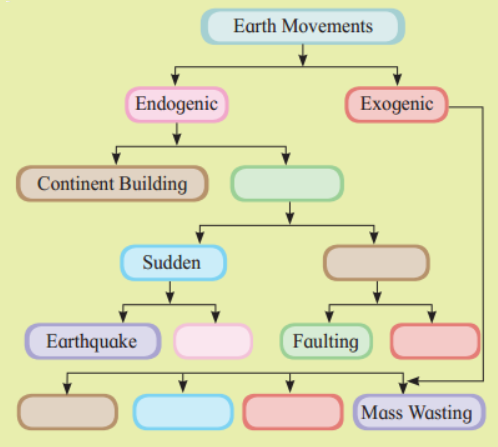
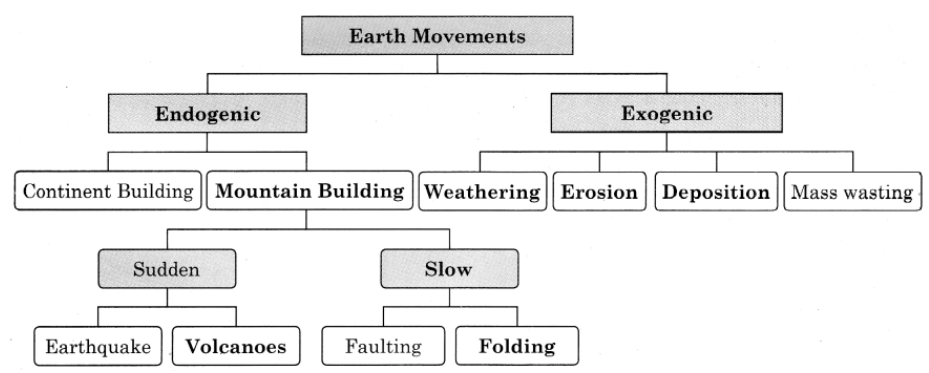
Complete the following flow chart.
Generate a complete, print-ready paper with questions like this in minutes — across 16+ boards, with answer keys.
| Types of Mass | Wasting Characteristics | Regions |
| (1) Creep | (1) Rapid fall | (1) Periglacial or alpine region |
| (2) Rockfall | (2) Slowest moving | (2) Hillsides in a humid region |
| (3) Earth flow | (3) Slow downhill creep | (3) Rocky areas |
| (4) Solifluction | (4) Rapid or slow | (4) Tops and basal portions of hills |
| A | B | C |
| (1) Continental Shelf | (1) Mariana Trench | (1) Methane Hydrate |
| (2) Continental Slope | (2) Mumbai High | (2) Coral Island |
| (3) Oceanic Ridges and Plateau | (3) Krishna-Godavari Basin | (3) Deepest Part |
| (4) Oceanic Trenches | (4) Aldabra | (4) Oil and Gas |
| Types of weathering | Factors | Resultant |
| $(1)$ Physical | $(1)$ Heat | $(1)$ Oxidation |
| $(2)$ Chemical | $(2)$ Explosion | $(2)$ Granular weathering |
| $(3)$ Anthropological | $(3)$ Water $(H_2O)$ | $(3)$ Exfoliation |
| $(4)$ Pressure | $(4)$ Mining |
| A | B | C |
| (1) the Mediterranean | (1) 40° to 50° N and S | (1) Maple, elm, walnut, deodar |
| (2) Temperate Deciduous | (2) 40° to 55° N and S | (2) Willow, alder, poplar, various species of grasses |
| (3) Temperate Grassland | (3) 30° to 40° N and S | (3) Pine, oak, cedar, rosemary |
| Measures | Pre-disaster/ Post-disaster | Structural or Non-Structural |
| (1) Public awareness | (1) Post-disaster | (1) Structural |
| (2) Preparedness of hospital | (2) Post-disaster | (2) Non-structural |
| (3) Providing food and shelter to people | (3) Pre-disaster | (3) Structural |
| (4) Construction of river embankments | (4) Post-disaster | (4) Non-structural |
| A | B | C |
| (1) Continental Shelf | (1) Deeper Part | (1) Manganese Nodules |
| (2) Oceanic Microorganisms | (2) Abyssal Plains | (2) Whales |
| (3) Oceanic Trenches | (3) Fishing | (3) Sunda |
| (4) Vast Flat Area | (4) Plankton | (4) Dogger Bank |
| Type of disaster | Name of Disaster | Place |
| (1) Tectonic | (1) Flood | (1) Malin |
| (2) Geological | (2) Plague | (2) Kerala |
| (3) Metrological | (3) Tsunami | (3) Surat |
| (4) Biological | (4) Mudslide | (4) Indonesia |
| A | B | C |
| (1) Melting of snow | (1) Increase in sea level | (1) Flooding |
| (2) Effects of insolation | (2) Erratic rains | (2) Increase in frequency of cyclones |
| (3) Greenhouse gases | (3) Methane | (3) Agriculture |
| (4) Climate change | (4) Average temperature of the earth | (4) Existence of life on Earth |
| A | B | C |
| (1) P-waves | (1) Ring of Fire | (1) Indonesia |
| (2) Volcanic eruption | (2) Shadow zone | (2) Italy |
| (3) Cinder cone | (3) Smoke | (3) Cauliflower cloud |
| (4) Tectonic movements | (4) Mt. Nuovo | (4) Cotopaxi |
| (5) Circum pacific belt | (5) Convergent and divergent margin | (5) Between 105° and 140° |