Question
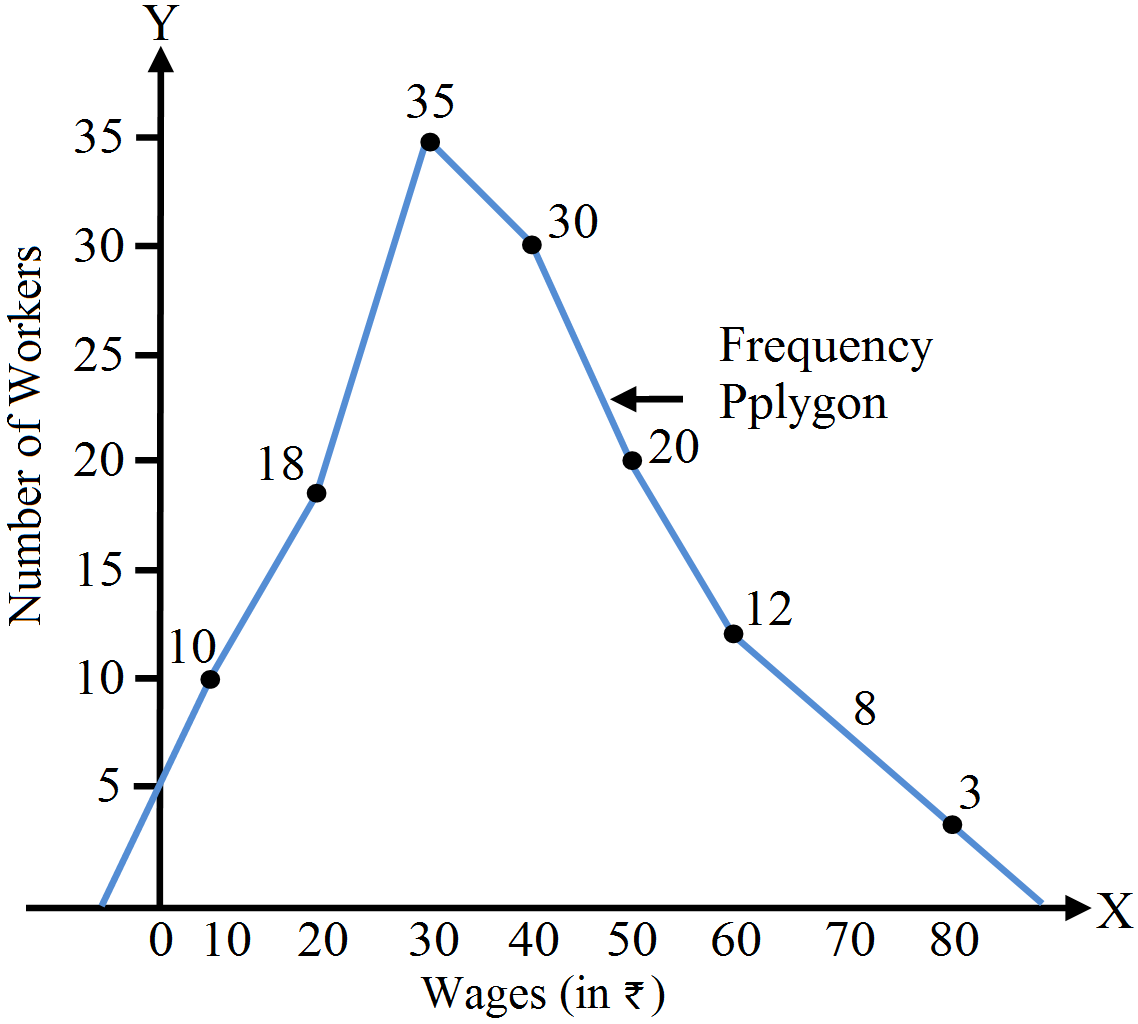
Construct a frequency polygon without using histogram for the following data.
Wages (in ₹)
Number of Workers (f)
0-10
10
10-20
18
20-30
35
30-40
30
40-50
20
50-60
12
60-70
8
70-80
3

Answer

To construct a frequency polygon without histogram the following values will be plotted.
Mid Value (X)
Number of Workers (f)
5
10
15
18
25
35
35
30
45
20
55
12
65
8
75
3

Need a full question paper?

Generate a complete, print-ready paper with questions like this in minutes — across 16+ boards, with answer keys.

Start Generating Free

Similar questions

Recast the following cumulative table into the form of an ordinary frequency distribution and determine value of the median.
Number of Days Absent
Number of Students
Less than 5
29
Less than 10
224
Less than 15
465
Less than 20
582
Less than 25
634
Less than 30
644
Less than 35
650
Less than 40
653
Less than 45
655
Calculate coefficient of correlation from the following data and interpret the result:
No. of years of schooling of farmers $0$ $2$ $4$ $6$ $8$ $10$ $12$
Annual yield per acre in $‘000 (₹)$ $4$ $4$ $6$ $10$ $10$ $8$ $7$
You are given the daily wages paid to workers in two factories $X$ and $Y$.
Wages No. of Workers
Factory X Factory Y
12-13 15 25
13-14 30 40
14-15 44 60
15-16 60 35
16-17 30 12
Using appropriate measures, answer the following:
  1. Which factory pays higher average wages?
  2. Which factory has a more consistent wage structure?
The two important functions of classification are:
  1. Scrutiny and editing of data.
  2. Presentation and interpretation of data.
  3. Reducing bulk data and facilitating comparison.
  4. forming trend and tendencies.
Find out coefficient of variation from the following data:
X 5 15 25 35 45 55 65
f 4 6 10 20 10 6 4
How is the demand for a commodity affected by changes in the price of related goods? Explain with the help of diagrams.
'Despite certain shortcomings, range is widely used due to its simplicity'. In the context of given statement, state merits and demerits of range as a measure of dispersion.
Explain with the help of diagrams, the effect of the following changes on the demand for a commodity:
(i) A rise in the price of substitute good.
(ii) A rise in the price of complementary good.
The frequency distribution of marks obtained by students in a class test is given below:
Marks (Midpoints)
45
55
65
75
85
No. of Students
5
9
12
8
2
Draw a Histogram from the above distribution.
How does improvement in technology and the consequent decline in production cost affect market equilibrium?