Question
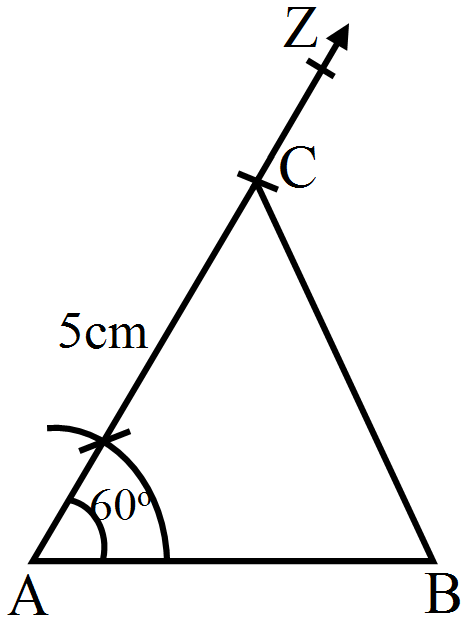
Construct a $\triangle\text{ABC}$ in which $AB = 3.8cm$, $\angle\text{A}=60^\circ$ and $AC = 5cm.$

Answer

Steps for construction:
Step I: Draw $AB$ of length $3.8\ cm$.
Step II: Draw $\angle\text{BAZ}=60^\circ$.
Step III: With the centre as $A$, cut ray $AZ$ at $5\ cm$ at $C.$
Step IV: Join $BC$. Then, $ABC$ is the required triangle.

Need a full question paper?

Generate a complete, print-ready paper with questions like this in minutes — across 16+ boards, with answer keys.

Start Generating Free

Similar questions

In Fig., $A B C$ is a right triangle right angled at $A . D$ lies on $B A$ produced and $D E \perp B C$, intersecting $A C$ at $F$. If $\angle A F E=130^{\circ}$, find
(i) $\angle B D E$ $\quad$ (ii) $\angle B C A$ $\quad$ (iii) $\angle A B C$
Image
A rectangular field is $50m$ by $40m$. It has two roads through its centre, running parallel to its sides. The widths of the longer and shorter roads are $1.8m$ and $2.5m$ respectively. Find the area of the roads and the area of the remaining portion of the field.
The following problem was set by Sridharacharya in his book, Patiganita.''$6 \frac{1}{4}$ is divided by $2 \frac{1}{2}$, and $60 \frac{1}{4}$ is divided by $3 \frac{1}{2}$ Tell the quotients separately.'' Can you try to solve by converting the fractions into decimals?
The diameter of the wheel of a car is $77\ cm.$ How many revolutions will it make to travel $121\ km?$
If $\frac{p}{q}=\left(\frac{-2}{3}\right)^9÷\left(\frac{-2}{3}\right)^8$, then find the value of $\left(\frac{p}{q}\right)^2$.
The production of saleable steel in some of the steel plants of our country during 1999 is given below:
PlantBhilaiDurgapurRourkelaBokaro
Production (In thousand tonnes)16080200150
Construct a bar graph to represent the above data on a graph paper by using the scale 1 big division = 20 thousand tonnes.
From the sum of $x^2+3 y^2-6 x y, 2 x^2-y^2+8 x y, y^2+8$ and $x^2-3 x y$ subtract $-3 x^2+4 y^2-x y+x-y+3$.
Find the value of the unknown x in the following diagrams.
Image
Image
The table below compares the population $($in hundreds$)$ of $4$ towns over two years:
Towns
$A$ $B$ $C$ $D$
$2007$
$2900$
$6400$
$8300$
$4600$
$2009$
$3200$
$7500$
$9200$
$6300$
Study the table and answer the following questions:
$a.$ Draw a double bar graph using appropriate scale to depict the above information.
$b.$ In which town was the population growth maximum?
$c.$ In which town was the population growth least?