Question
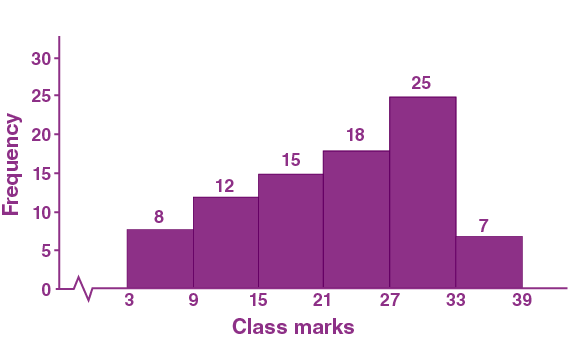
Construct histograms for following frequency distribution:
| Class Mark | 6 | 12 | 18 | 24 | 30 | 36 |
| Frequency | 8 | 12 | 15 | 18 | 25 | 7 |
| Class Mark | 6 | 12 | 18 | 24 | 30 | 36 |
| Frequency | 8 | 12 | 15 | 18 | 25 | 7 |
| Class Interval | Frequency |
| 3-9 | 8 |
| 9-15 | 12 |
| 15-21 | 15 |
| 21-27 | 18 |
| 27-33 | 25 |
| 33-39 | 7 |
Generate a complete, print-ready paper with questions like this in minutes — across 16+ boards, with answer keys.
| Marks | No. of students |
| 50-60 | 4 |
| 60-70 | 8 |
| 70-80 | 14 |
| 80-90 | 19 |
| 90-100 | 5 |
Draw a histrogram for the above data using a graph paper and locate the mode.
| Marks | 0 and above | 10 and above | 20 and above | 30 and above | 40 and above | 50 and above | 60 and above | 70 and above | 80 and above | 90 and above | 100 and above |
| Number of students | 80 | 77 | 72 | 65 | 55 | 43 | 28 | 16 | 10 | 8 | 0 |
| 16 | 20 | 26 | 27 | 28 |
| 30 | 33 | 37 | 38 | 40 |
| 42 | 43 | 46 | 46 | 47 |
| 48 | 49 | 50 | 53 | 58 |
| 59 | 60 | 64 | 52 | 20 |
| Weekly pocket money (₹) | No. of student |
| 40 - 50 | 2 |
| 59 - 60 | 8 |
| 60 - 70 | 12 |
| 70 - 80 | 14 |
| 80 - 90 | 8 |
| 90 - 100 | 6 |