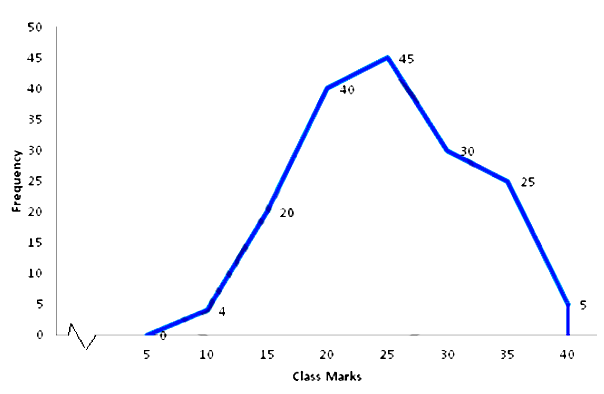
Question 14 Marks
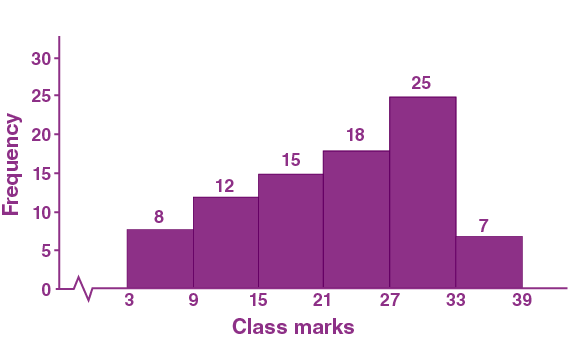
Construct histograms for following frequency distribution:
| Class Mark | 15 | 25 | 35 | 45 | 50 | 55 | 60 |
| Frenuencv | 6 | 12 | 15 | 18 | 25 | 14 | 10 |
Answer
View full question & answer→Steps:
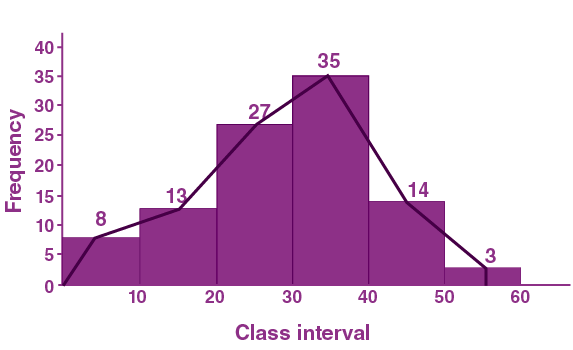
a. Make the class intervals continuous by taking class mark as midpoints.
b. On the $x$-axis, take $1 \mathrm{~cm}$ as 5 units and plot class interval.
c. On the y-axis, take $1 \mathrm{~cm}$ as 5 units and plot frequency.
d. Draw rectangles of histogram as per given data.
a. Make the class intervals continuous by taking class mark as midpoints.
b. On the $x$-axis, take $1 \mathrm{~cm}$ as 5 units and plot class interval.
c. On the y-axis, take $1 \mathrm{~cm}$ as 5 units and plot frequency.
d. Draw rectangles of histogram as per given data.
| Class Interval | Frequency |
| 0-9.5 | - |
| 9.5-19.5 | 6 |
| 19.5-29.5 | 12 |
| 29.5-39.5 | 15 |
| 39.5-47.5 | 18 |
| 47.5-52.5 | 25 |
| 52.5-57.5 | 14 |
| 57.5-62.5 | 10 |