Question
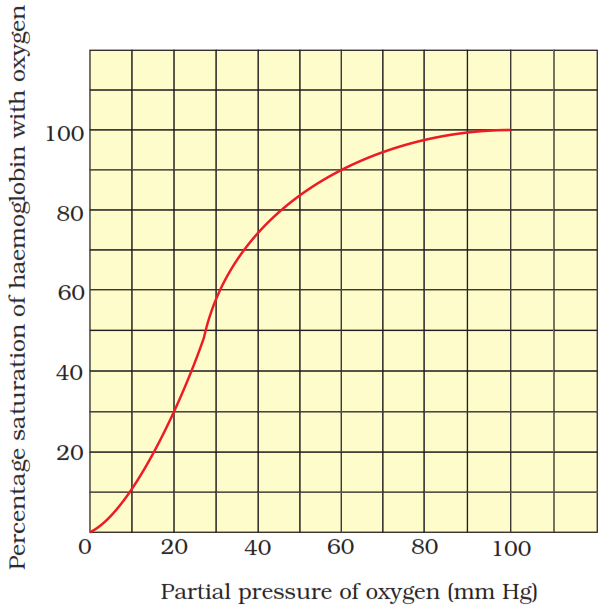
Define oxygen dissociation curve. Can you suggest any reason for its sigmoidal pattern?

Answer

  • The oxygen dissociation curve is a graph obtained when the percentage saturation of haemoglobin with oxygen is plotted against the partial pressure of oxygen.
  • When the first molecule of oxygen binds to haemoglobin, its affinity for the second molecule of oxygen increases.
  • Hence, the formation of oxyhaemoglobin is faster which is indicated by the steep slope of the S curve.
  • When the formation of oxyhaemoglobin comes to rest or when there are no haemoglobin molecules available for binding, the curve achieves a plateau phase.

Need a full question paper?

Generate a complete, print-ready paper with questions like this in minutes — across 16+ boards, with answer keys.

Start Generating Free