Question
Density $vs$ volume graph is shown in the figure. Find corresponding pressure $vs$ temperature graph
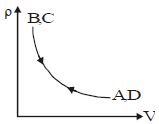
It means $BC$ and $AD$ is a isochoric process. So, option $(3)$ is correct
Generate a complete, print-ready paper with questions like this in minutes — across 16+ boards, with answer keys.
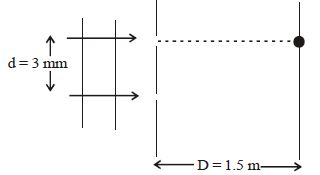
Given $D = \ 1.5\ m$
$d = 3\ mm$
$4500 \ Å < \lambda_1 , \lambda_2 < 7000\ Å$
then $n, m$ and $\lambda_1$ are