Question
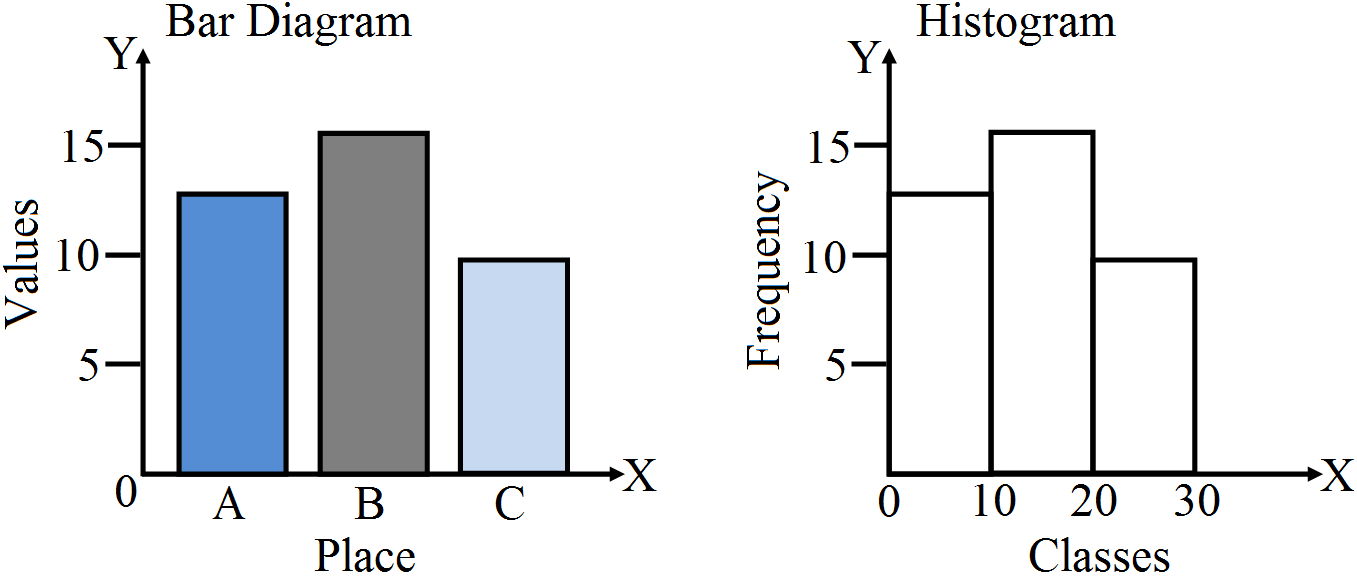
Distinguish between a bar diagram and a histogram.

Generate a complete, print-ready paper with questions like this in minutes — across 16+ boards, with answer keys.
| Price (₹) | 10 | 20 | 30 | 40 | 50 |
| Market Demand (Units) | 550 | 450 | 350 | 250 | 150 |
| Market Supply (Units) | 150 | 250 | 350 | 450 | 550 |
|
X
|
f
|
|
Less than 10
|
5
|
|
Less than 20
|
15
|
|
Less than 30
|
55
|
|
Less than 40
|
75
|
|
Less than 50
|
100
|