Question
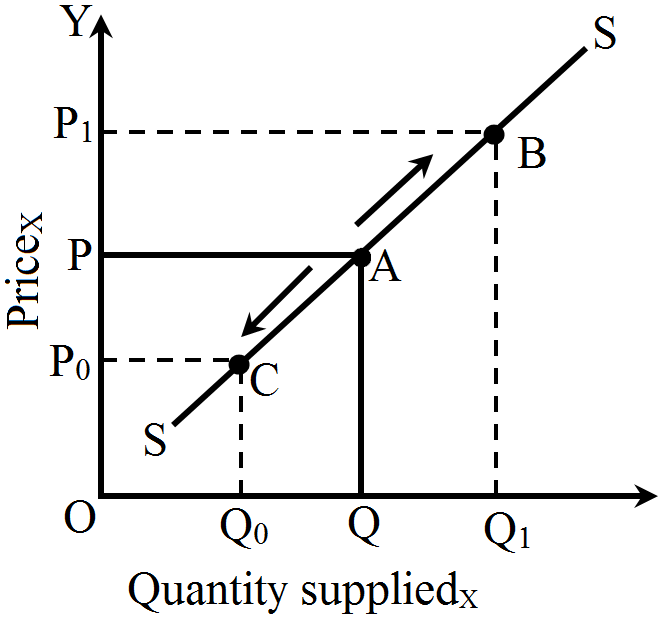
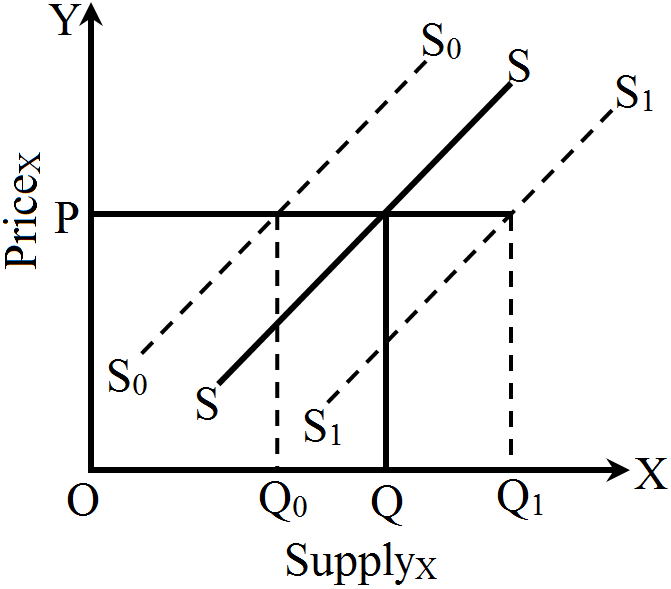
Distinguish between a change in supply and change in quantity supplied.
OR
Explain the distinction between "Change in quantity supplied” and “Change in supply”. Use diagram.

Answer

S. No
Basis
Change in Quantity Supplied/ Movement along a supply curve
Change in supply/ Shift in supply curve
1.
Causes
Change in quantity supplied is caused by change in price of the commodity alone, other factors remaining constant.
Change in supply is caused by factor other than the price of the commodity, i.e., change in price of related commodities or change in the state of technology or change in price of inputs etc.
2.
Curve
Change in quantity supplied of a commodity is denoted by the 'movement along a supply curve'.
  • Upward movement along a supply curve denotes 'expansion of supply'.
  • Downward movement along a supply curve denotes 'contraction of supply'.
 
Change supply is denoted by a "shift of the supply curve".
  • Rightward shift in supply curve denotes ‘increase in supply'.
  • Leftward shift in supply curve denotes decrease in supply.
3.
Diagram

Need a full question paper?

Generate a complete, print-ready paper with questions like this in minutes — across 16+ boards, with answer keys.

Start Generating Free

Similar questions

How will a fall in price of tea affect the equilibrium price of coffee? Explain the chain of effects.
Using marginal cost and marginal revenue approach, find out the level of output at which producer will be in equilibrium. Give reasons for your answer.
Output (Units) 1 2 3 4 5 6
Average Revenue (Rs.) 20 20 20 20 20 20
Total Cost (Rs.) 22 42 60 76 96 120
What would be an effect on equilibrium price and quantity when demand and supply both shifts rightward?
OR
What would be an effect on equilibrium price and quantity when there is simultaneous increase in demand and supply?

OR
"If the demand and supply of a commodity both increase, the equilibrium price may not change, may increase, may decrease." Explain using diagrams.

OR
Market for a good is in equilibrium. There is simultaneous "increase" both in demand and supply of the good. Explain its effect on market price.
On the basis of the information given below, determine the level of output at which the producer will be in equilibrium. Use the marginal cost-marginal revenue approach. Give reasons for your answer.
Output (Units) Average Revenue(₹) Total Cost(₹)
1 7 7
2 7 15
3 7 22
4 7 28
5 7 33
6 7 40
7 7 48
When price of a commodity X falls by 10 per cent, its demand rises from 150 units to 180 units. Calculate its price elasticity of demand. How much should be the percentage fall in its price so that its demand rises from 150 to 210 units?
State the different phases of changes in Total Product and Marginal Product in the Law of Variable Proportions. Also show the same in a single diagram.
Market for a good is in equilibrium. Explain the chain of reactions in the market if the price is (i) higher than equilibrium price and (ii) lower than equilibrium price.
Given below is a cost and revenue schedule of a producer. At what level of output is the producer in equilibrium? Give reasons for your answer:
Output (units) Price (₹) Total Cost (₹)
1 10 13
2 10 22
3 10 30
4 10 38
5 10 47
6 10 57
7 10 71
A consumer consumes only two goods $X$ and $Y$ whose prices are Rs. $5$ and Rs. $4$ respectively. If the consumer chooses a combination of the two goods with marginal utility of $X$ equal to $4$ and that of $Y$ equal to $5$, is the consumer in equilibrium? Why or why not? What will a rational consumer do in this situation? Use utility analysis.
Define price elasticity of demand. Explain its various degrees. Use diagrams.