Question
What would be an effect on equilibrium price and quantity when demand and supply both shifts rightward?
OR
What would be an effect on equilibrium price and quantity when there is simultaneous increase in demand and supply?

OR
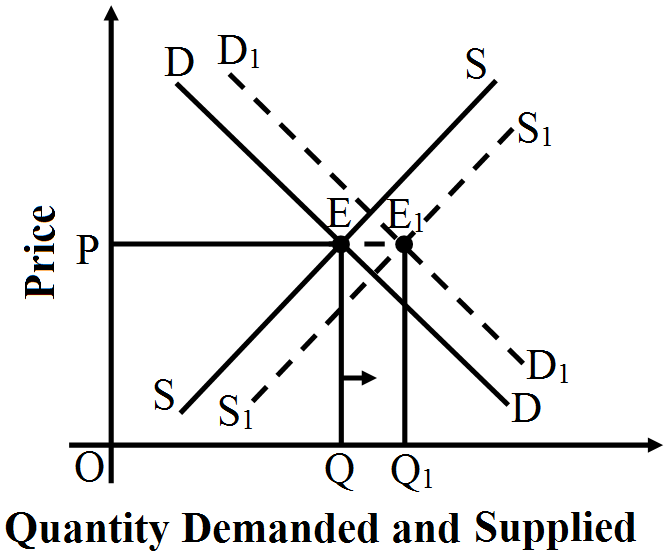
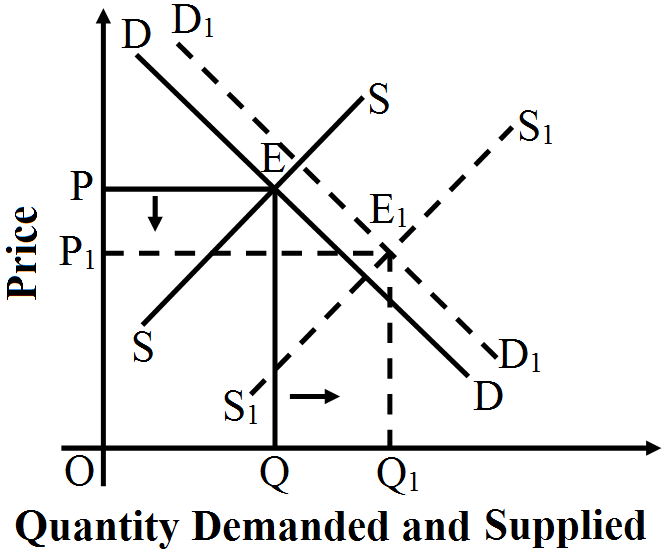
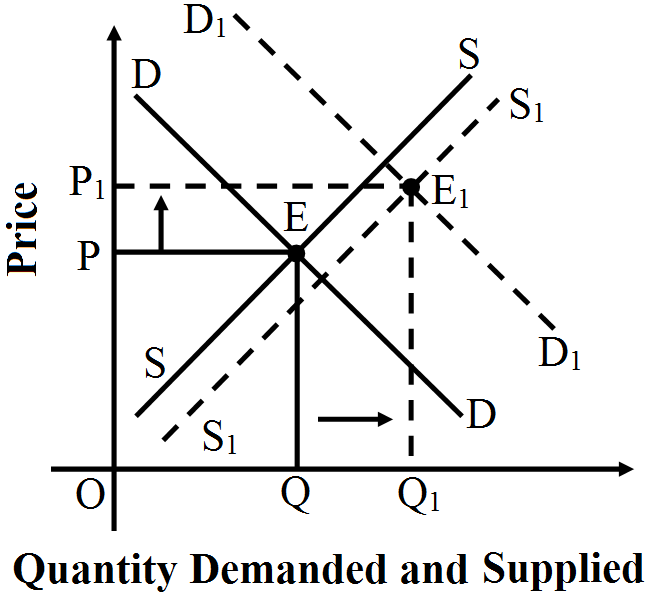
"If the demand and supply of a commodity both increase, the equilibrium price may not change, may increase, may decrease." Explain using diagrams.

OR
Market for a good is in equilibrium. There is simultaneous "increase" both in demand and supply of the good. Explain its effect on market price.

Answer

There are three cases: Case I: When demand and supply both increase at the same rate In the given diagram price is measured on vertical axis and quantity demanded and supplied is measured on horizontal axis. Initially, the equilibrium price is OP and equilibrium quantity is OQ. But when "demand and supply both increase at the same rate" then,
  1. Equilibrium price remains constant at OP.
  2. Equilibrium quantity rises from OQ to $OQ_1$.

Case II: When demand increases, supply also increases but at a much faster rate In the given diagram price is measured on vertical axis and quantity demanded and supplied is measured on horizontal axis. Initially, the equilibrium price is OP and equilibrium quantity is OQ. But when "demand increases and supply also increases but at a much faster rate", then,
  1. Equilibrium price falls from OP to $OP_1$
  2. Equilibrium quantity rises from OQ to $OQ_1​​​​​​​$​​​​​​​.

Case III: When supply increases, demand also increases but at a much faster rate In the given diagram price is measured on vertical axis and quantity demanded and supplied is measured on horizontal axis. Initially, the equilibrium price is OP and equilibrium quantity is OQ. But when "supply increases and demand also increases but at a much faster rate" then,
  1. Equilibrium price rises from OP to $OP_1$​​​​​​​.
  2. Equilibrium quantity also rises from OQ to $OQ_1$​​​​​​​.

Need a full question paper?

Generate a complete, print-ready paper with questions like this in minutes — across 16+ boards, with answer keys.

Start Generating Free

Similar questions

Find out the marginal cost in:
Total Output
(Units)
Total Cost (Rs)
0
120
1
180
2
200
3
210
4
230
5
270
6
360
Find out the missing value of the variate for the following distribution whose mean is 31.87.
Value (X)12202733?54
Frequency (f)8164890308
  1. Explain briefly the situation of excess demand in a perfectly competitive market. Use diagram.
  2. Explain briefly the situation of excess supply in a perfectly competitive market. Use diagram.
The demand for goods $X $and $Y$ have equal price elasticity. The demand of good $X$ rises from $100$ units to$ 250$ units due to a $20 $percent fall in its price. Calculate the percentage rise in demand of $Y$ if its price falls by $8$ percent.
Explain the relationship between Marginal Cost and Average Cost using diagram.
Distinguish between:
  1. Fixed Costs and Variable Costs.
  2. Average Cost and Marginal Cost.
A table showing TC and TR of a firm is given. Calculate MC and MR and find out the equilibrium level of output.
Output
1
2
3
4
5
6
7
8
9
10
TC
45
80
95
105
135
175
225
285
360
440
TR
40
80
120
160
200
240
280
320
360
400
Explain the concept of marginal rate of substitution (MRS) by giving an example. What happens to MRS when a consumer moves downwards along the indifference curve? Give reasons for your answer.
A consumer consumes only two goods $X$ and $Y$. Explain the conditions of consumer’s equilibrium using Marginal Utility Analysis.
Explain the implications of the following in perfectly competitive market:
  1. Large number of sellers.
  2. Homogenous products.