Question
Distinguish between change in quantity supplied and change in supply. Use diagram.
| Basis | Changes in quantity supplied | Change in supply | ||||||||||||||||||||||||
| Meaning | The change in quantity supplied due to the change in price of the commodity. | Change in supply due to the change in factors other than price. | ||||||||||||||||||||||||
| Alternative name | Movement along the supply curve: | Shift in supply curve: | ||||||||||||||||||||||||
| (i) Expansion in supply. | (i) Increase in supply. | |||||||||||||||||||||||||
| (ii) Contraction in supply. | (ii) Decrease in supply. | |||||||||||||||||||||||||
| Meaning | (i) It states that rise in quantity supplied due to the rise in price of the commodity. | (i) An increase in supply means that producers now supply more at a given price level. | ||||||||||||||||||||||||
| (ii) It states that fall in quantity supplied due to the fall in price of the commodity. | (ii) A decrease in supply means that producers now supply less at a given price level. | |||||||||||||||||||||||||
| Schedule |
|
| ||||||||||||||||||||||||
| Diagrams | 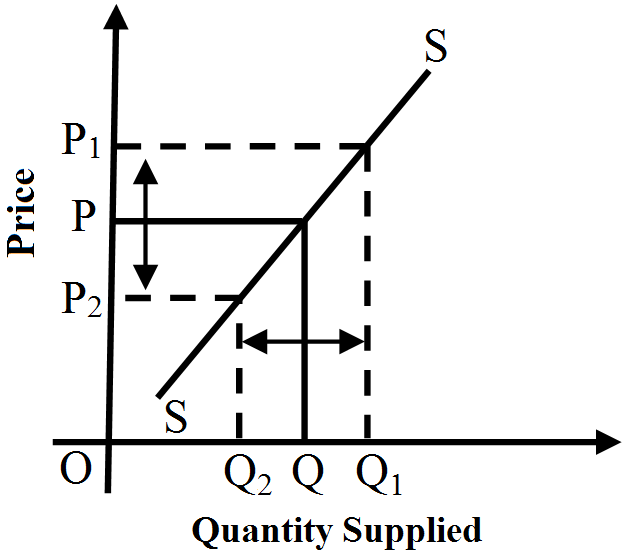 | 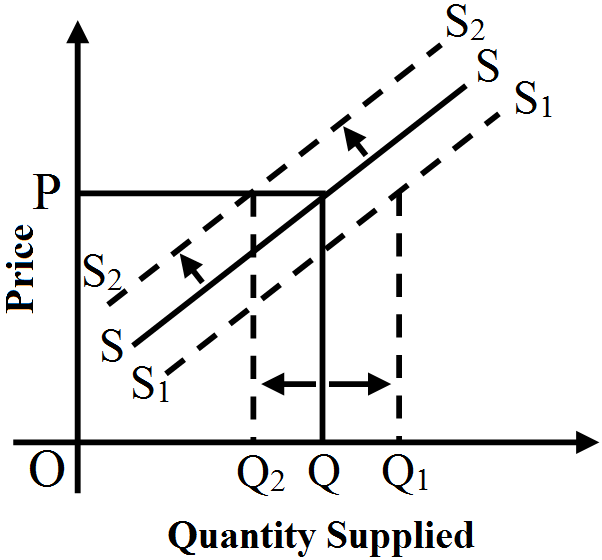 | ||||||||||||||||||||||||
Generate a complete, print-ready paper with questions like this in minutes — across 16+ boards, with answer keys.
OR
Explain with the help of a diagram and using Saving = Investment approach the determination of equilibrium output and income level in an economy. What happens when the economy is not in equilibrium and saving exceeds investment?OR
Distinguish between normal goods and inferior goods, with examples.| ₹ in crores | ||
| (i) | Compensation of employees | 250 |
| (ii) | Mixed income of self-employed | 600 |
| (iii) | Profit | 80 |
| (iv) | Rent | 30 |
| (v) | Interest | 40 |
| (vi) | Net factor income to abroad | (–) 10 |
| (vii) | Net exports | 15 |
| (viii) | Consumption of fixed capital | 20 |
| (ix) | Net indirect taxes | 10 |
| (x) | Net current transfers to abroad | 8 |