Question
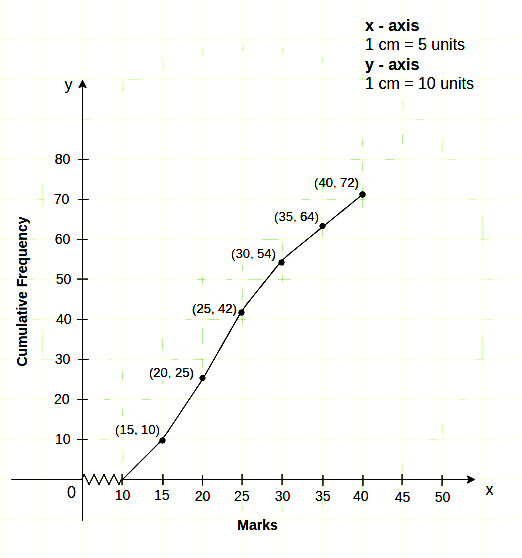
Draw a cumulative frequency curve (ogive) for the following distributions:
Class Interval 10 – 15 15 – 20 20 – 25 25 – 30 30 – 35 35 – 40
Frequency 10 15 17 12 10 8

Answer

Class Interval Frequency C.F.
10-15 10 10
15-20 15 10 + 15 = 25
20-25 17 25 + 17 = 42
25-30 12 42 + 12 = 54
30-35 10 54 + 10 = 64
35-40 08 64 + 8 = 72

Taking upper class limits along x-axis and corresponding cumulative frequencies along y-axis, mark the points (10, 0), (15, 10), (20, 25), (25, 42), (30, 54), (35, 64) and (40, 72).

Need a full question paper?

Generate a complete, print-ready paper with questions like this in minutes — across 16+ boards, with answer keys.

Start Generating Free