Question 12 Marks
The following table shows the distribution of the heights of a group of factory workers:
| Ht. (cm) | 150 - 155 | 155 – 160 | 160 - 165 | 165 – 170 | 170 – 175 | 175 - 180 | 180 – 185 |
| No of workers: | 6 | 12 | 18 | 20 | 13 | 8 | 6 |
(i) Determine the cumulative frequencies.
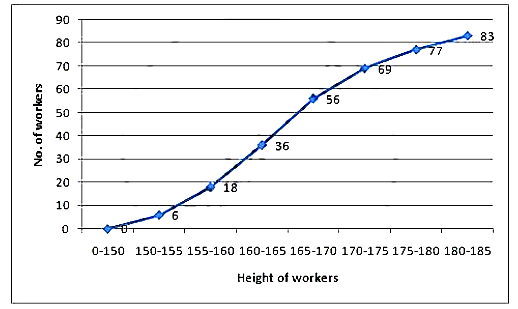
(ii) Draw the ‘less than’ cumulative frequency curve on graph paper. Use 2 cm = 5 cm height on one axis and 2 cm = 10 workers on the other.
Answer
We plot the points (155, 6), (160, 18), (165, 36), (170, 56), (175, 69),
(180, 77) and (185, 83) on the graph and join them in free hand to obtain an ogive.
View full question & answer→| Height ( in cm) | No. of workers | c.f. |
| 150-155 | 6 | 6 |
| 155-160 | 12 | 18 |
| 160-165 | 18 | 36 |
| 165-170 | 20 | 56 |
| 170-175 | 13 | 69 |
| 175-180 | 8 | 77 |
| 180-185 | 6 | 83 |
(180, 77) and (185, 83) on the graph and join them in free hand to obtain an ogive.