Question
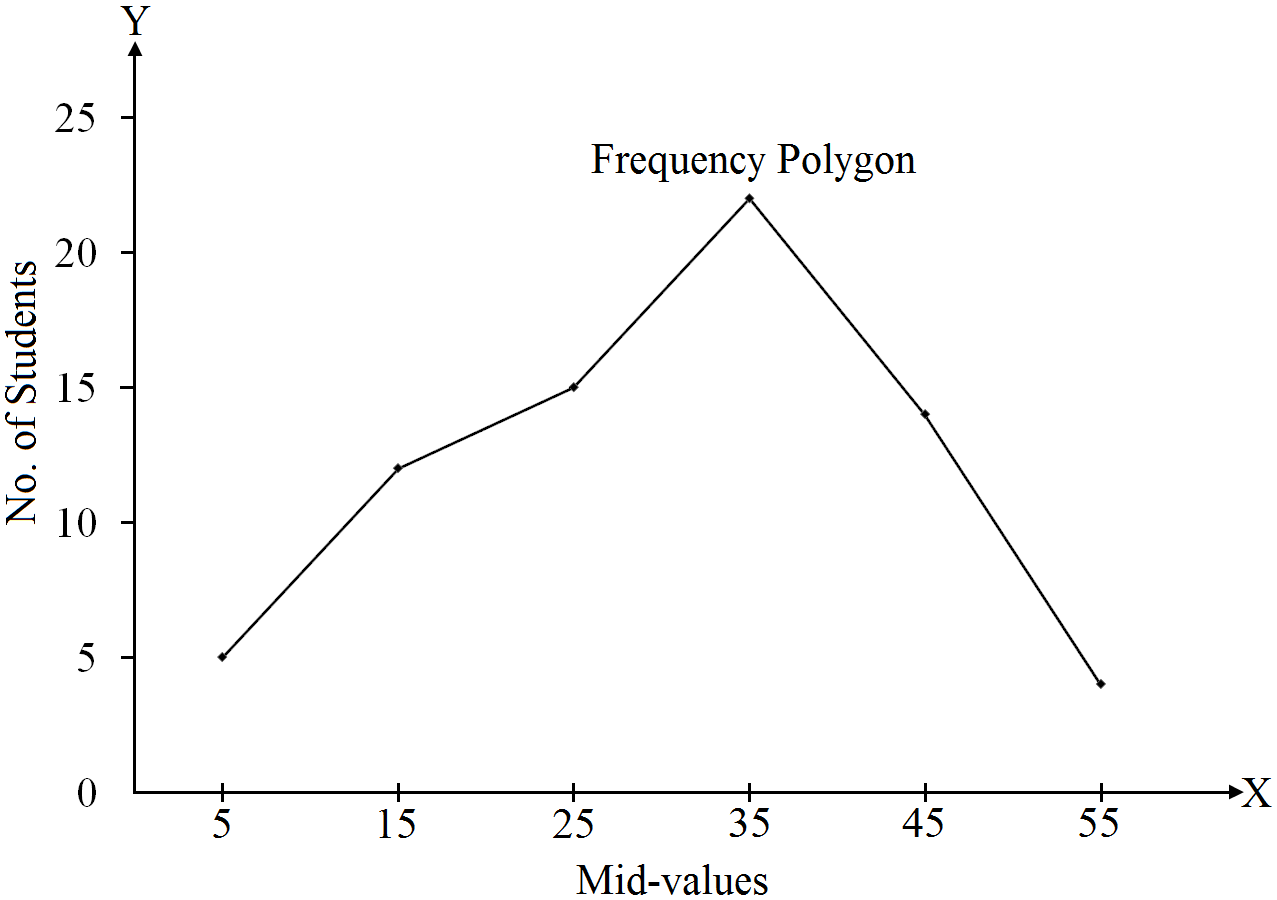
Draw a frequency polygon using mid-values from the following table:
Marks
0-10
10-20
20-30
30-40
40-50
50-60
No. of Students
5
12
15
22
14
4

Answer

Marks
Mid-value
f
0-10
5
5
10-20
15
12
20-30
25
15
30-40
35
22
40-50
45
14
50-60
55
4

Need a full question paper?

Generate a complete, print-ready paper with questions like this in minutes — across 16+ boards, with answer keys.

Start Generating Free

Similar questions

The following series relates to the daily income of workers employed in a firm. Compute (a) highest income of lowest 50% workers (b) minimum income earned by the top 25% workers and (c) maximum income earned by lowest 25% workers.
Daily Income (in ₹) 10-14 15-19 20-24 25-29 30-34 35-39
Number of workers 5 10 15 20 10 5
Hint: Compute median, lower quartile and upper quartile.
The yield of wheat and rice per acre for 10 districts of a state is as under:
District
1
2
3
4
5
6
7
8
9
10
Wheat
12
10
15
19
21
16
18
9
25
10
Rice
22
29
12
23
18
15
12
34
18
12
Calculate for crop.
Mean deviation about Median.
Plot the time series graph for the given information:
Years
2015
2016
2017
2018
2019
Exports (₹ in '000)
50
100
120
80
40
Profit (₹ in '000)
10
40
80
50
90
Calculate the mean deviation from median and coefficient of $MD$ from the given data.
X Frequency
12 8
18 12
25 15
35 23
47 16
55 18
62 31
75 12
Explain the conditions of consumer's equilibrium with the help of marginal utility analysis
Answer the following questions
(i) When price of a commodity falls by Rs 1 per unit, its quantity demanded rises by 3 units. Its Price Elasticity of Demand is (-) 2. Calculate its quantity demanded if the price before change was Rs 10 per unit.
(ii) A consumer buys 30 units of a good at a price of Rs. 10 per unit. Price elasticity of demand for the good is (-)1. How many units the consumer will buy at a price of Rs. 9 per unit Rs. Calculate.
What does a consumer price index for industrial workers measure?
Record the daily expenditure, quantities bought and prices paid per unit of the daily purchases of your family for two weeks. How has the price change affected your family?
State relation between mean, median and mode in normal and skewed distribution with an example.
Construct a pie diagram to represent the cost of construction of a house in Delhi:
Items
Labour
Bricks
Cement
Steel
Timber
Supervision
Expenditure (%)
25
15
20
15
10
15