Question
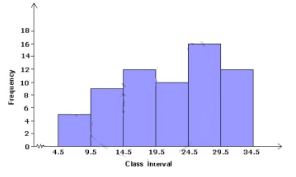
Draw a histogram for the following frequency table:
| Class interval | $5 - 9$ | $10 - 14$ | $15 - 19$ | $20 - 24$ | $25 - 29$ | $30 - 34$ |
| Frequency | $5$ | $9$ | $12$ | $10$ | $16$ | $12$ |