Question
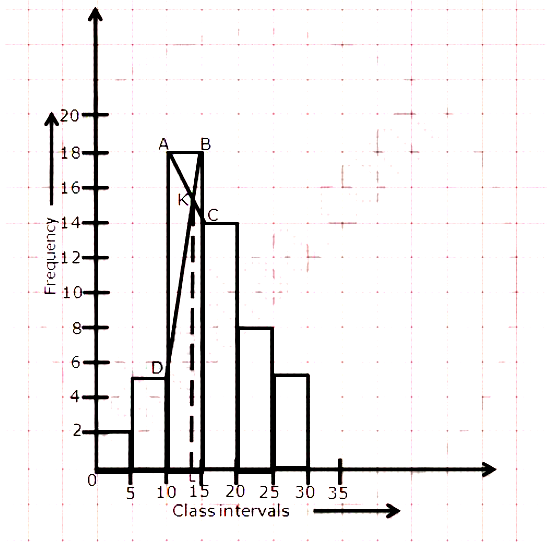
Draw a histogram from the following frequency distribution and find the mode from the graph:
| Class | 0-5 | 5-10 | 10-15 | 15-20 | 20-25 | 25-30 |
| Frequency | 2 | 5 | 18 | 14 | 8 | 5 |
| Class | 0-5 | 5-10 | 10-15 | 15-20 | 20-25 | 25-30 |
| Frequency | 2 | 5 | 18 | 14 | 8 | 5 |
Generate a complete, print-ready paper with questions like this in minutes — across 16+ boards, with answer keys.
| Pocket expenses (in ₹) | Number of students (frequency) |
| 0 - 5 | 10 |
| 5 - 10 | 14 |
| 10 - 15 | 28 |
| 15 - 20 | 42 |
| 20 - 25 | 50 |
| 25 - 30 | 30 |
| 30 - 35 | 14 |
| 35 - 40 | 12 |