Question
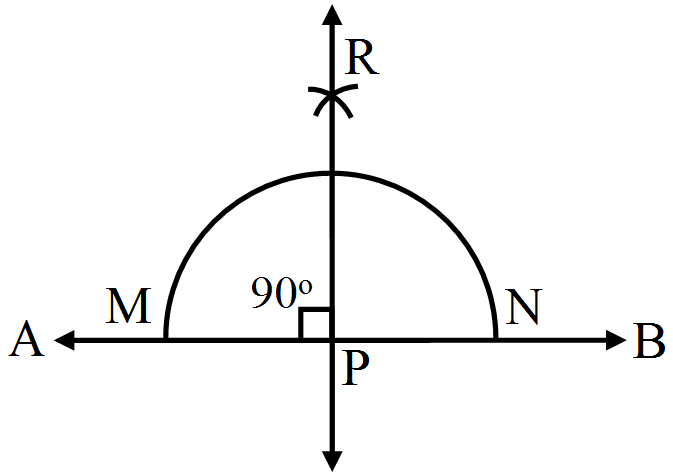
Draw a line AB. Take a point P on it. Draw a line passing through P and perpendicular to AB.

Answer


Steps for construction:
  1. Draw a line AB.
  2. Take a point P on line AB.
  3. With P as the centre, draw an arc of any radius, which intersects line AB at M and N, respectively.
  4. With M as the centre and radius more than half of MN, draw an arc.
  5. With N as the centre and the same radius as in step (4), draw an arc that cuts the previously drawn arc at R.
  6. Draw PR. PR is the required line, which is perpendicular to AB.

Need a full question paper?

Generate a complete, print-ready paper with questions like this in minutes — across 16+ boards, with answer keys.

Start Generating Free

Similar questions

$1 \frac{1}{4}+3 \frac{1}{2}$
The following bar graph shows the number of persons killed in industrial accidents in a country for some years.

Read the bar graph and choose the correct alternative in each of the following:
  1. The year which shows the maximum percentage increase in the number of persons killed in coal mines over the precending year is:
  1. 1996
  2. 1997
  3. 1999
  4. 2000
  1. The year which shows the maximum decrease in the number of persons killed in industrial accidents over the precending year is:
  1. 1996
  2. 1997
  3. 1998
  4. 1999
  1. The year in which the maximum number of persons were killed in industrial accidents other than those killed in coal mines is:
  1. 1995
  2. 1997
  3. 1998
  4. 1999
Find out the LCM of the following numbers.
i. 9,15
ii. 2,3,5
iii. 12,28
iv. 15,20
v. 8,11
Draw a line l. Take a point A, not lying on l. Draw a line m such that $\text{m}\perp\text{l}$ and passing through A. Using ruler and compasses.
In a mathematics test following marks were obtained by 40 students of class VI. Arrange these marks in a table using, tally marks.
8
1
3
7
6
5
5
4
4
2
4
9
5
3
7
1
6
5
2
7
7
3
8
4
2
8
9
5
8
6
7
4
5
6
9
6
4
4
6
6
  1. Find how many students obtained marks equal to or more than 7?
  2. How many students obtained marks below 4?
The following data shows the average age of men in various countries in a certain year.
Country
India
Nepal
China
Pakistan
U.K
U.S.A
Average age (in years)
55
52
60
50
70
75
Represent the above information by a bar graph.
Find the HCF of the numbers in the following using the division method:754, 1508, 1972
The number of customers who came to a juice centre during one week is given in the table below. Make two different bar graphs to show this data.
(On Y-axis, 1 cm = 10 customers, 1 cm = 5 customers)
Type of juiceOrangePineappleAppleMangoPomegranate
Number of customers5030256510
Draw a pair of vertically opposite angles. Bisect each of the two angles. Verify that the bisecting rays are in the same line.
Study the bar graph representing the number of persons in various age groups in a town shown in Observe the bar graph and answer the following questions:
  1. What if the percentage of the youngest age-group persons over those in the oldest age group?
  2. What is the total population of the town?
  3. What is the number of persons in the age-group 60-65?
  4. How many persons are more in the age-group 10-15 than in the age group 30-35?
  5. What is the age-group of exactiy 1200 persons living in the town?
  6. What is the total number of persons living in the town in the age-group 50-55?
  7. What is the total muner of persons living in the town in the age-groups 10-15 and 60-65?
  8. Whether the population in general increases, decreases or remains constant with the increase in the age-group.