Question
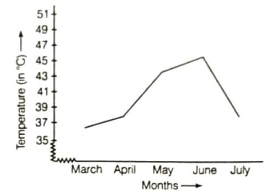
Draw a line graph of the following table which shows the relation between highest temperature in month from March to July.
| Months | March | April | May | june | July |
| Highest Temperature (°C) | 38° | 40° | 45° | 47° | 39° |