Question 13 Marks
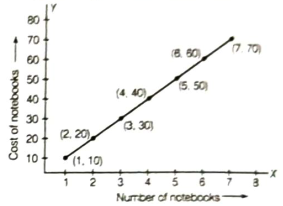
Draw the graphs for the following tables of values, with suitable scales on the axes.
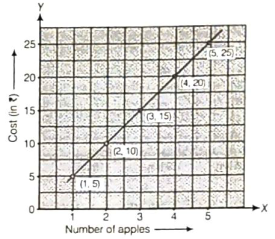
(i) Cost of apples
(ii) Distance travelled by a car
(a) How much distance did the car cover during the period 7:30 am to 8 am?
(b) What was the time when the car had covered a distance of 100 km , since it's start?
(iii) Interest on deposits for a year.
(a) Does the graph pass through the origin?
(b) Use the graph to find the interest on ₹ 2500 for a year.
(c) To get an interest of ₹ 280 per year, how much money should be deposited?
(i) Cost of apples
| Number of apples | 1 | 2 | 3 | 4 | 5 |
| Cost (in ₹) | 5 | 10 | 15 | 20 | 25 |
| Time (in h) | 6 am | 7 am | 8 am | 9 am |
| Distances (in km) | 40 | 80 | 120 | 160 |
(b) What was the time when the car had covered a distance of 100 km , since it's start?
(iii) Interest on deposits for a year.
| Deposit (in ₹) | 1000 | 2000 | 3000 | 4000 | 5000 |
| Simple interest (in ₹) | 80 | 160 | 240 | 320 | 400 |
(b) Use the graph to find the interest on ₹ 2500 for a year.
(c) To get an interest of ₹ 280 per year, how much money should be deposited?
Answer
View full question & answer→(i) To draw the graph for the following table of values, we use the following steps :
Step I Firstly, draw $X$-axis and $Y$-axis and take scale on horizontal 2 units $=$ Number of apples and on vertical 2 units $=$ ₹ $ 5$.
Step II Mark the number of apples along the $X$-axis and mark the cost (in ₹) along the $Y$-axis.
Step III Plot the points $(1,5),(2,10),(3,15),(4,20)$ and $(5,25)$ on graph paper.
Step IV Join these points. Then, we get a required linear graph which is shown below.
(ii) To draw the graph for the given table of values, we use the following steps
Step I Draw $X$-axis and $Y$-axis and take scale, on horizontal axis 3 units = 1h, on vertical axis 1 unit =20 km.
Step II Mark the time (in hours) on horizontal axis and distance (in km ) on vertical axis.
Step III Now, plot the points (6,40),(7,80),(8,120) and (9,160) on graph paper.
Step IV Join these points.
Then, we get a linear graph which is shown below
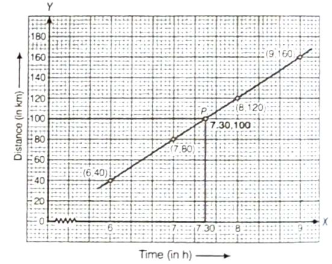
(a) In the graph, corresponding to 7:30 am on horizontal axis, we get the distance 100 km on vertical axisi.e. point $P$. Distance covered during the period 7:30 am to 8 : 00 am = (120 - 100) = 20 km
(b) In the given graph, ( from point $p$ ) at 7:30 am the car had covered a distance of 100 km , since it's start.
(iii) To draw the graph of given table of values, we use the following steps
Step I Draw $X$-axis and $Y$-axis and take scale, on
horizontal axis, 2 units $=$ ₹ $1000$
on vertical axis, 2 units $=$ ₹ $80$
Step II Mark deposit (in ₹) on horizontal axis and simple interest (in ₹) on vertical axis.
Step III Now, plot the points $(1000,80),(2000,160)$, $(3000,240),(4000,320)$ and $(5000,400)$ on the graph paper.
Step IV Join these points.
Then, we get a adjoining linear graph.
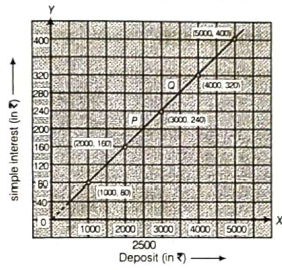
(a) Yes, the graph passes through the origin when we extending the graph towards $O$ (origin).
(b) To find the interest on ₹ 2500, locate 2500 on the horizontal axis. Follow the vertical line through 2500 till we meet the graph at P (say). From P, take a horizontal line to meet the vertical axis. This meeting point gives the simple interest ₹ 200 for ₹ 2500. Hence, the interest on ₹ 2500 for a year is ₹ 200.
(c) To get deposit money for interest of ₹ 280, locate 280 on the vertical axis. Follow the horizontal line through 280 till we meet the graph at Q (say). From Q take a vertical line to meet the horizontal axis. This meeting point gives the deposit money ₹ 3500 for interest ₹ 280.₹ 3500 should be deposited to get an interest of ₹ 280.
Step I Firstly, draw $X$-axis and $Y$-axis and take scale on horizontal 2 units $=$ Number of apples and on vertical 2 units $=$ ₹ $ 5$.
Step II Mark the number of apples along the $X$-axis and mark the cost (in ₹) along the $Y$-axis.
Step III Plot the points $(1,5),(2,10),(3,15),(4,20)$ and $(5,25)$ on graph paper.
Step IV Join these points. Then, we get a required linear graph which is shown below.
(ii) To draw the graph for the given table of values, we use the following steps
Step I Draw $X$-axis and $Y$-axis and take scale, on horizontal axis 3 units = 1h, on vertical axis 1 unit =20 km.
Step II Mark the time (in hours) on horizontal axis and distance (in km ) on vertical axis.
Step III Now, plot the points (6,40),(7,80),(8,120) and (9,160) on graph paper.
Step IV Join these points.
Then, we get a linear graph which is shown below
(a) In the graph, corresponding to 7:30 am on horizontal axis, we get the distance 100 km on vertical axisi.e. point $P$. Distance covered during the period 7:30 am to 8 : 00 am = (120 - 100) = 20 km
(b) In the given graph, ( from point $p$ ) at 7:30 am the car had covered a distance of 100 km , since it's start.
(iii) To draw the graph of given table of values, we use the following steps
Step I Draw $X$-axis and $Y$-axis and take scale, on
horizontal axis, 2 units $=$ ₹ $1000$
on vertical axis, 2 units $=$ ₹ $80$
Step II Mark deposit (in ₹) on horizontal axis and simple interest (in ₹) on vertical axis.
Step III Now, plot the points $(1000,80),(2000,160)$, $(3000,240),(4000,320)$ and $(5000,400)$ on the graph paper.
Step IV Join these points.
Then, we get a adjoining linear graph.
(a) Yes, the graph passes through the origin when we extending the graph towards $O$ (origin).
(b) To find the interest on ₹ 2500, locate 2500 on the horizontal axis. Follow the vertical line through 2500 till we meet the graph at P (say). From P, take a horizontal line to meet the vertical axis. This meeting point gives the simple interest ₹ 200 for ₹ 2500. Hence, the interest on ₹ 2500 for a year is ₹ 200.
(c) To get deposit money for interest of ₹ 280, locate 280 on the vertical axis. Follow the horizontal line through 280 till we meet the graph at Q (say). From Q take a vertical line to meet the horizontal axis. This meeting point gives the deposit money ₹ 3500 for interest ₹ 280.₹ 3500 should be deposited to get an interest of ₹ 280.