Question
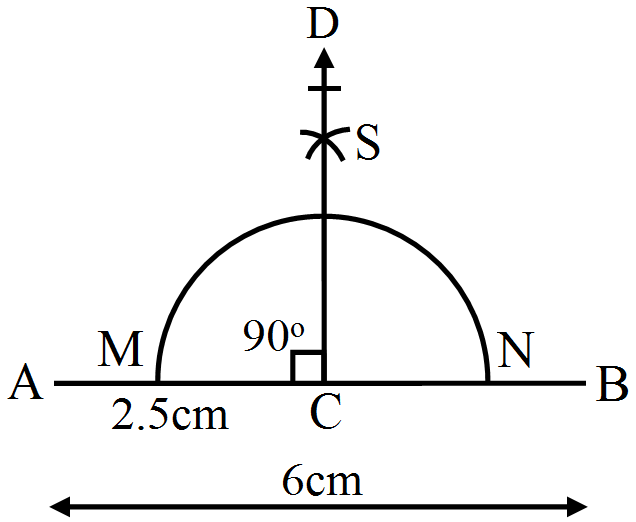
Draw a line segment AB = 6cm. Take a point C on AB such that AC = 2.5cm. Draw CD perpendicular to AB.

Answer


Steps of constructions:
  1. Draw a line segment AB, which is equal to 6cm.
  2. Take a point C on AB such that AC is equal to 2.5cm.
  3. With C as the centre, draw an arc cutting AB at M and N.
  4. With M as the centre and radius more than half of MN, draw an arc.
  5. With N as the centre and the same radius as before, draw another arc cutting the perviously drawn arc at S.
  6. Draw SC and produce it to D.

Need a full question paper?

Generate a complete, print-ready paper with questions like this in minutes — across 16+ boards, with answer keys.

Start Generating Free

Similar questions

Ramanujan’s Magic square.

Image

  • Add the four numbers in the rows, the columns and along the diagonals of this square.
  • What is the sum?
  • Is it the same every time?
  • What is the peculiarity?
  • Look at the numbers in the first row, 22 – 12 – 1887. Find out why this date is special.

Obtain and read a biography of the great Indian mathematician Srinivasa Ramanujan.

Draw an angle of 45°, using a pair of compasses.
The following data shows the average age of men in various countries in a certain year.
Country
India
Nepal
China
Pakistan
U.K
U.S.A
Average age (in years)
55
52
60
50
70
75
Represent the above information by a bar graph.
Match the equivalent fractions and write another 2 for each:
(i) $\frac{250}{400}$ (a) $\frac{2}{3}$
(ii) $\frac{180}{200}$ (b) $\frac{2}{5}$
(iii) $\frac{660}{990}$ (c) $\frac{1}{2}$
(iv) $\frac{180}{360}$ (d) $\frac{5}{8}$
(v) $\frac{220}{550}$ (e) $\frac{9}{10}$
Ravish's house is $\frac{9}{10}\text{km}$ from his school. He walked some distance and then took a bus for $\frac{1}{2}\text{km}$ up to the school. How far did he walk?
Find the HCF of the numbers in the following using the division method:391, 425, 527
Identify the symmetrical instruments from your mathematical instrument box.
The following table shows the daily production of T.V. sets in an industry for 7 days of a week:
Day
Mon
Tue
Wed
Thurs
Fri
Sat
Sun
Number of T.V. Sets
300
400
150
250
100
350
200
Represent the above information by a pictograph.
The following data gives the production of food grains (in thousand tones) for some years:
Years
1995
1996
1997
1998
1999
2000
Production (in thousand tonnes)
120
150
140
180
170
190
Represent the above data with the help of a bar graph.
Draw a quadrilateral. Draw one diagonal of this quadrilateral and divided it into two triangles. Measures all the angles in the figure. Is the sum of the measures of the four angles of the quadrilateral equal to the sum of the measures of the six angles of the two triangles? Verity that this is so with other quadrilaterals.