Question
Draw a rhombus whose side is 7.2cm and one angle is 60°.

Answer


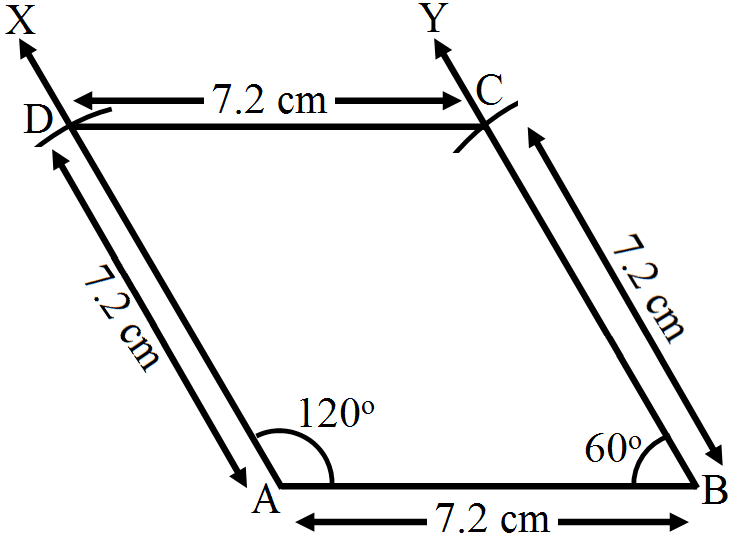
Steps of construction:
Step 1: Draw AB = 7.2cm.
Step 2: Draw
$\angle\text{ABY}=60^\circ$
$\angle\text{BAX}=120^\circ$
Sum of the adjacent angles is 180°.
$\angle\text{BAX}+\angle\text{ABY}=180^\circ$
$\Rightarrow\angle\text{BAX}=180^\circ-60^\circ=120^\circ$
Step 3:
Set off AD (7.2cm) along AX and BC (7.2cm) along BY.
Step 4: Join C and D.
Then, ABCD is the required rhombus.

Need a full question paper?

Generate a complete, print-ready paper with questions like this in minutes — across 16+ boards, with answer keys.

Start Generating Free

Similar questions

Factories: $\left(a^2-54\right)^2-36$
The following table shows the percentages of buyers of four different brands of bathing soaps.
Brand
A B C D
Percentage of buyers
20%
40%
25%
15%
Represent the above data by a pie chart.
Find the area of pentagon ABCDE in which $\text{BL}\perp\text{AC},\text{DM}\perp\text{AC}$ and $\text{EN}\perp\text{AC}$ such that AC = 18cm, AM = 14cm, AN = 6cm, BL = 4cm, DM = 12cm and EN = 9cm.
ABCD is a rhombus whose diagonals intersect at O. If AB = 10cm, diagonal BD = 16cm, find the length of diagonal AC.
Rs 3500 is to be shared among three people so that the first person gets 50% of the second, who in turn gets 50% of the third. How much will each of them get?
Draw the velocity-time graph from the following data:
Time (in hours): 7:00 8:00 9:00 10:00 11:00 12:00 13:00 14:00
Speed (in km/ hr): 30 45 60 50 70 50 40 45
Solve the following equation and also check your result in case:
$\frac{4\text{x}}{9}+\frac{1}{3}+\frac{13}{108}\text{x}=\frac{8\text{x}+19}{18}$
The runs scored by two teams A and B in first 10 overs are given below:
Overs: I II III IV V VI VII VIII IX X
Team A: 2 1 8 9 4 5 6 10 6 2
Team B: 5 6 2 10 5 6 3 4 8 10
Draw a graph depicting the data, making the graphs on the same axes in each case in two different ways as a graph and as a bar chart.
In a convex hexagon, prove that the sum of all interior angles is equal to twice the sum of its exterior angles formed by producing the sides in the same order.
The following table gives the distances travelled by a car at various time-intervals. Study the table and draw a linear graph for the same.
Time
6 a.m.
7 a.m.
8 a.m.
9 a.m.
Distance (in km)
40
80
120
160
From your graph, answer the questions given below:
  1. How much distance did the car cover during the period from 7:30 a.m. to 8 a.m.
  2. What was the time when the car had covered a distance of 100km, since its start?
  3. How much distance had the car covered by 8:30 a.m.?